IMAGE

Figure 2

ID
ZDB-IMAGE-200406-47
Source
Figures for Sivalingam et al., 2020
Image
Figure Caption

Figure 2

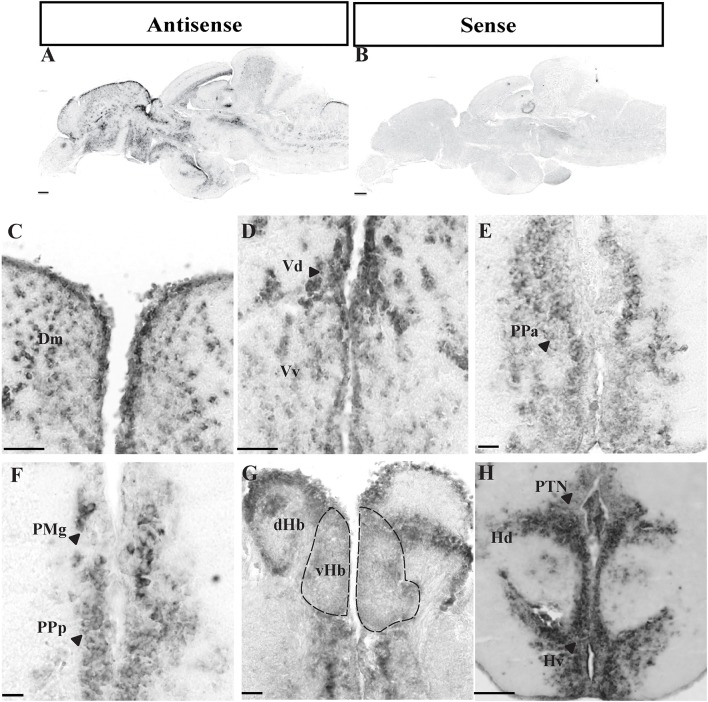
Expression of oprm1 mRNA in the brain of zebrafish. Photomicrographs showing expression of oprm1 genes in sagittal (A,B) and coronal sections (C–H) of zebrafish brain. (A) Antisense probe for oprm1 gene showed positive signal and (B) Sense probes for oprm1 gene showed no signals. (C) Medial zone of dorsal telencephalic area, (D) Dorsal and Ventral nucleus of ventral telencephalic area, (E,F) Anterior and posterior part of parvocellular preoptic area, (G) Habenula area, and (H) Periventricular hypothalamic area. N = 3, Scale bars: A–B (100 μm) and C–H (50 μm).

Acknowledgments
This image is the copyrighted work of the attributed author or publisher, and ZFIN has permission only to display this image to its users. Additional permissions should be obtained from the applicable author or publisher of the image. Full text @ Front. Neuroanat.