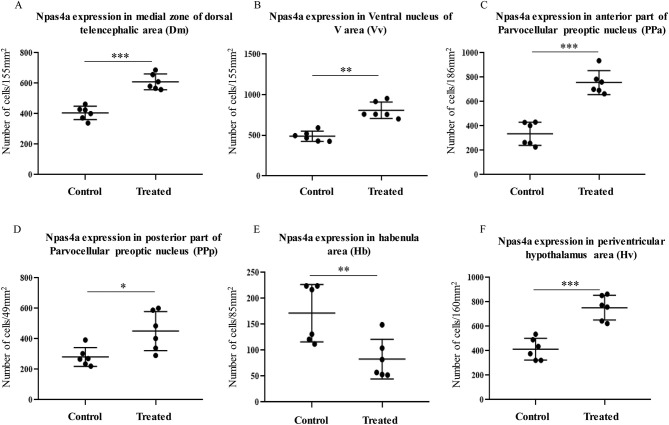
IMAGE

Figure 6

ID
ZDB-IMAGE-200406-3
Source
Figures for Sivalingam et al., 2020
Image
Figure Caption

Figure 6

Number of npas4 mRNA expressing cells in control and morphine-treated fish. (A–F) Graphs showing the difference in npas4a mRNA expression via cell counting after exposure to acute vehicle (control) and morphine via water immersion. (A) Medial zone of the dorsal telencephalic area, (B) ventral nucleus of the ventral telencephalic area, (C,D) anterior and posterior part of parvocellular preoptic area, (E) habenula, and (F) ventral periventricular hypothalamus. Data are presented as mean ± SEM. Independent t-test comparisons between control and morphine-treated fish. *P < 0.05; **P < 0.01, ***P < 0.001 vs. controls (n = 6).

Acknowledgments
This image is the copyrighted work of the attributed author or publisher, and ZFIN has permission only to display this image to its users. Additional permissions should be obtained from the applicable author or publisher of the image. Full text @ Front. Neuroanat.