
Figure 1
- ID
- ZDB-IMAGE-200406-276
- Genes
- Publication
- Mateus et al., 2020 - BMP Signaling Gradient Scaling in the Zebrafish Pectoral Fin
- All Figures
- Figures for Mateus et al., 2020
|
Figure 1
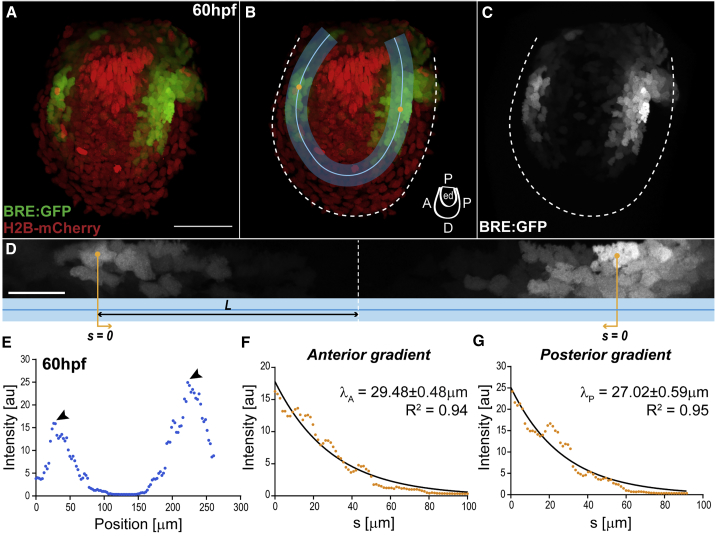
BMP Signaling Gradients in the Pectoral Fin
(A–C) Fin of double transgenic BRE:GFP (green) and Histone2b-mCherry (red), at 60 hpf. The BRE reporter expresses GFP under the control of Smad1/5/8 enhancers from the mouse Id1 promoter (
(B) Region of interest (ROI, blue; with ROI midline) where gradients are deployed: endoskeletal disc, abutting the fin fold. Cartoon indicates fin axes and endoskeletal disc (ed).
(D) BRE:GFP gradient along the straightened ROI (blue; anterior left) from (B). Orange lines indicate position
Scale bars: 50 μm (A–C), 20 μm (D).
(E) BRE:GFP intensity profile along the ROI midline from (B)–(D), at 60 hpf. Arrowheads, intensity maxima. Intensity corresponds to signal average orthogonal to midline.
(F and G) Anterior (F) and posterior (G) intensity profiles from (E) versus position
See also