
|
Figure 3
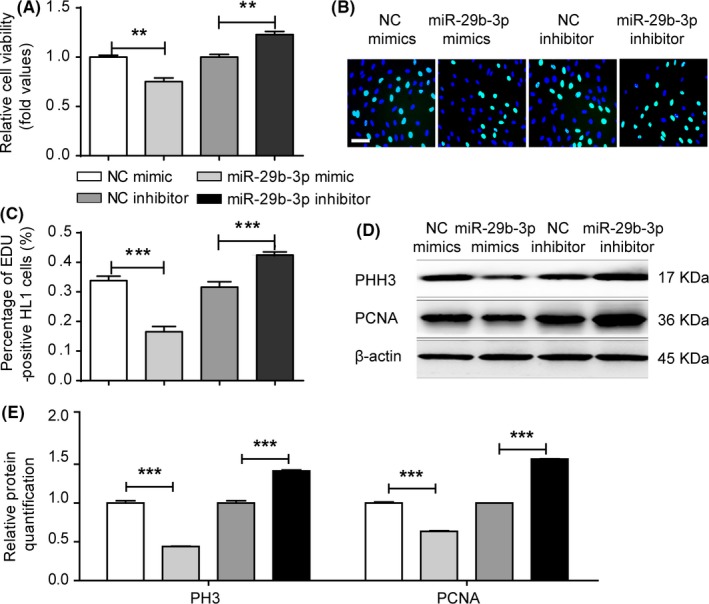
MiR‐29b‐3p decreased HL1 cell proliferation. A, Cell viability assay was assessed via CCK‐8 assays. Cell viability was lower in the miR‐29b‐3p mimic group and higher in its inhibitor group. B and C, EdU incorporation assay of cardiomyocytes. Microscopy images illustrated the EdU and Hoechst staining of cardiomyocytes after transfection with miR‐29b‐3p mimic or inhibitor (bar = 50 μm). The percentage of proliferating cardiomyocytes was calculated (n > 1000). EdU incorporation was decreased in the miR‐29b‐3p mimic group and enhanced in its inhibitor group. D, WB analysis of PHH3 and PCNA. E, Relative quantification of PHH3 and PCNA protein. The expressions of PHH3 and PCNA protein were down‐regulated in the miR‐29b‐3p mimic group and up‐regulated in its inhibitor group. The data are presented as the mean ± SEM. Statistical significance is shown as *