
|
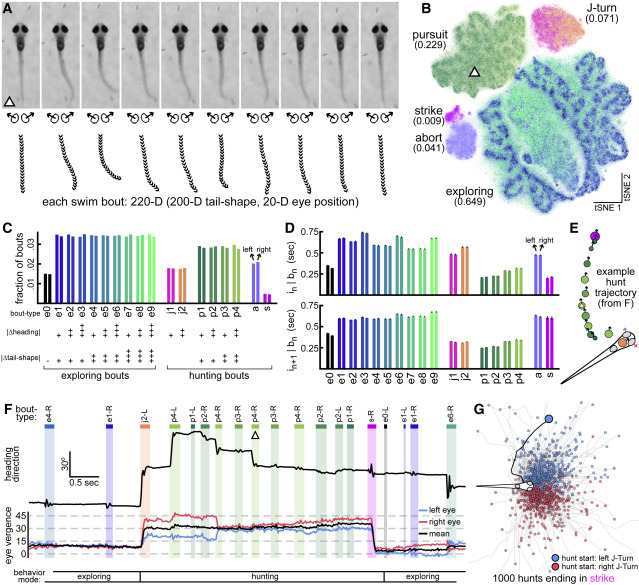
Fig. 2 Exploring and Hunting Bout-Type Categorization (A) Bouts are represented as 10-frame postural sequences beginning at bout initiation. Bout shown immediately follows image from Figure 1J. (B) Bout dataset embedded in 2D space with tSNE. Five bout classes (abundances in parentheses) identified with density-based clustering (Figure S2). Location of bout from (A) indicated with triangle. Each bout is a point, colored by bout type (see C for colormap). (C) Large bout classes are subdivided to get bout types. Plus signs indicate kinematic parameter magnitude. (D) Duration (mean ± SE) of interbout intervals preceding (top) and following (bottom) left and right versions of each bout type. (E) Trajectory of 13-bout hunt ending in strike. Circle locations and arrows indicate head position and heading direction preceding bout initiation. Circle colors indicate bout type. Circle areas are proportional to tail shape. (F) Hunt from (E) contained in a longer bout sequence. Heading direction and eye vergence angles shown over time with bout and interbout epochs indicated. Bout from (A) indicated (triangle). See Video S2 for corresponding video data. (G) Trajectories from 1,000 complete hunts ending in strike (black line, hunt from E).