
|
Fig. 2
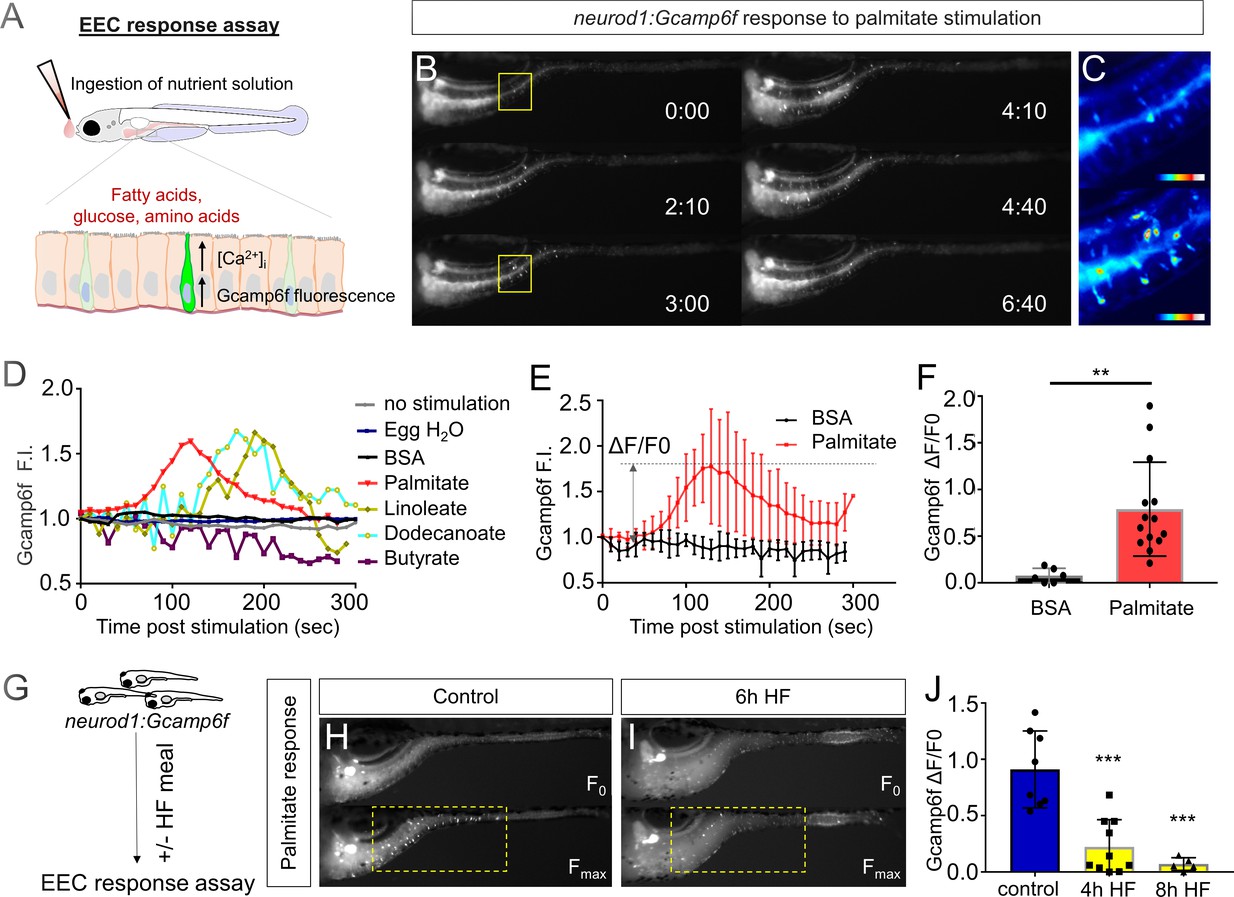
High fat feeding impairs the EEC calcium response toward palmitate stimulation.
( A) Measurement of the EEC response to nutrient stimulation using Tg(neurod1:Gcamp6f). ( B) Time lapse image of the EEC response to BSA conjugated palmitate stimulation in Tg(neurod1:Gcamp6f) using the EEC response assay. Note that palmitate responsive EECs are primarily in the proximal intestine. ( C) Heat map image indicating the EEC calcium response at 0 and 3 min post palmitate stimulation from the highlighted area in B. ( D) Change in Gcamp6f relative fluorescence intensity in 5 min with no stimulation or stimulation with egg water, BSA vehicle, palmitate, linoleate, dodecanoate or butyrate. Note that only palmitate, linoleate and dodecanoate induced EEC calcium responses. ( E, F) Change in Gcamp6f relative fluorescence intensity in BSA stimulated (n = 4) and palmitate stimulated animals (n = 5). ( G) Measurement of EEC calcium responses to palmitate stimulation following 4–8 hr of high fat (HF) meal feeding in 6 dpf Tg(neurod1:Gcamp6f)larvae. ( H, I) Representative images of the EEC response to palmitate stimulation in control larvae (without HF meal feeding, ( H) and 6 hr of HF feeding ( I). ( J) Measurement of EEC calcium responses to palmitate stimulation in Tg(neurod1:Gcamp6f) larvae following 4 and 8 hr HF feeding. Student t-test was used in F and one-way ANOVA with post-hoc Tukey test was used in J. **p<0.01, ***p<0.001.