
|
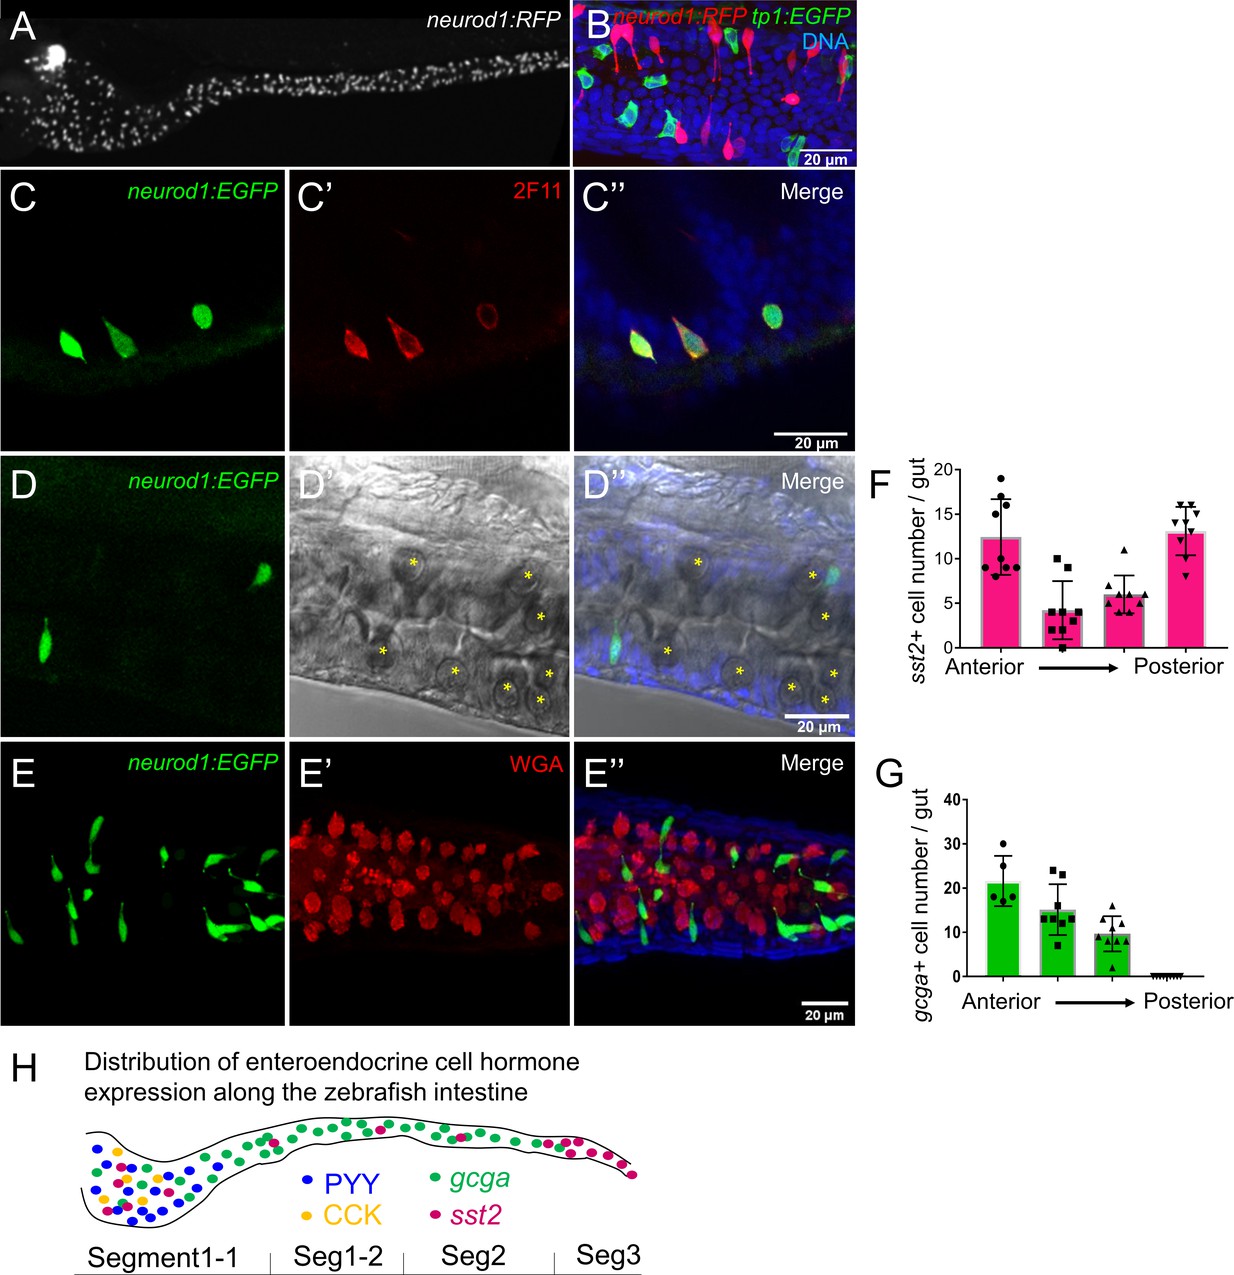
Fig. 1-S1
Characterization of zebrafish enteroendocrine cells.
( A) Fluorescence images of Tg(neurod1:RFP) 6 dpf zebrafish intestine. Neurod1 is expressed in islet cells of the pancreas and enteroendocrine cells in the intestine. ( B) Confocal projection of zebrafish EECs marked by Tg(neurod1:RFP). Note that red neurod1+ EECs are not overlapping with green tp1+ cells. ( C) Immunofluorescence staining of 6 dpf TgBAC(neurod1:EGFP) with the intestinal secretory cell marker 2F11 (red). ( D) Confocal plane of zebrafish intestine from TgBAC(neurod1:EGFP). Goblet cells are identified by their specific cell shape in the white field ( B’’) and EGFP labeled EECs do not overlap with goblet cells. ( E) Confocal projection of zebrafish EECs marked by TgBAC(neurod1:EGFP). Mucus in goblet cells is labeled with WGA lectin (red). neurod1+ EECs do not stain with WGA. ( F) Quantification of somatostatin+ cells that are labeled by Tg(sst2:RFP) in the 6 dpf zebrafish intestine. ( G) Quantification of glucagon+ cells that are labeled by Tg(gcga:EGFP) in the 6 dpf zebrafish intestine. ( H) Schematic depiction of EEC hormone distribution along the intestinal segments of 6 dpf zebrafish larvae.