
|
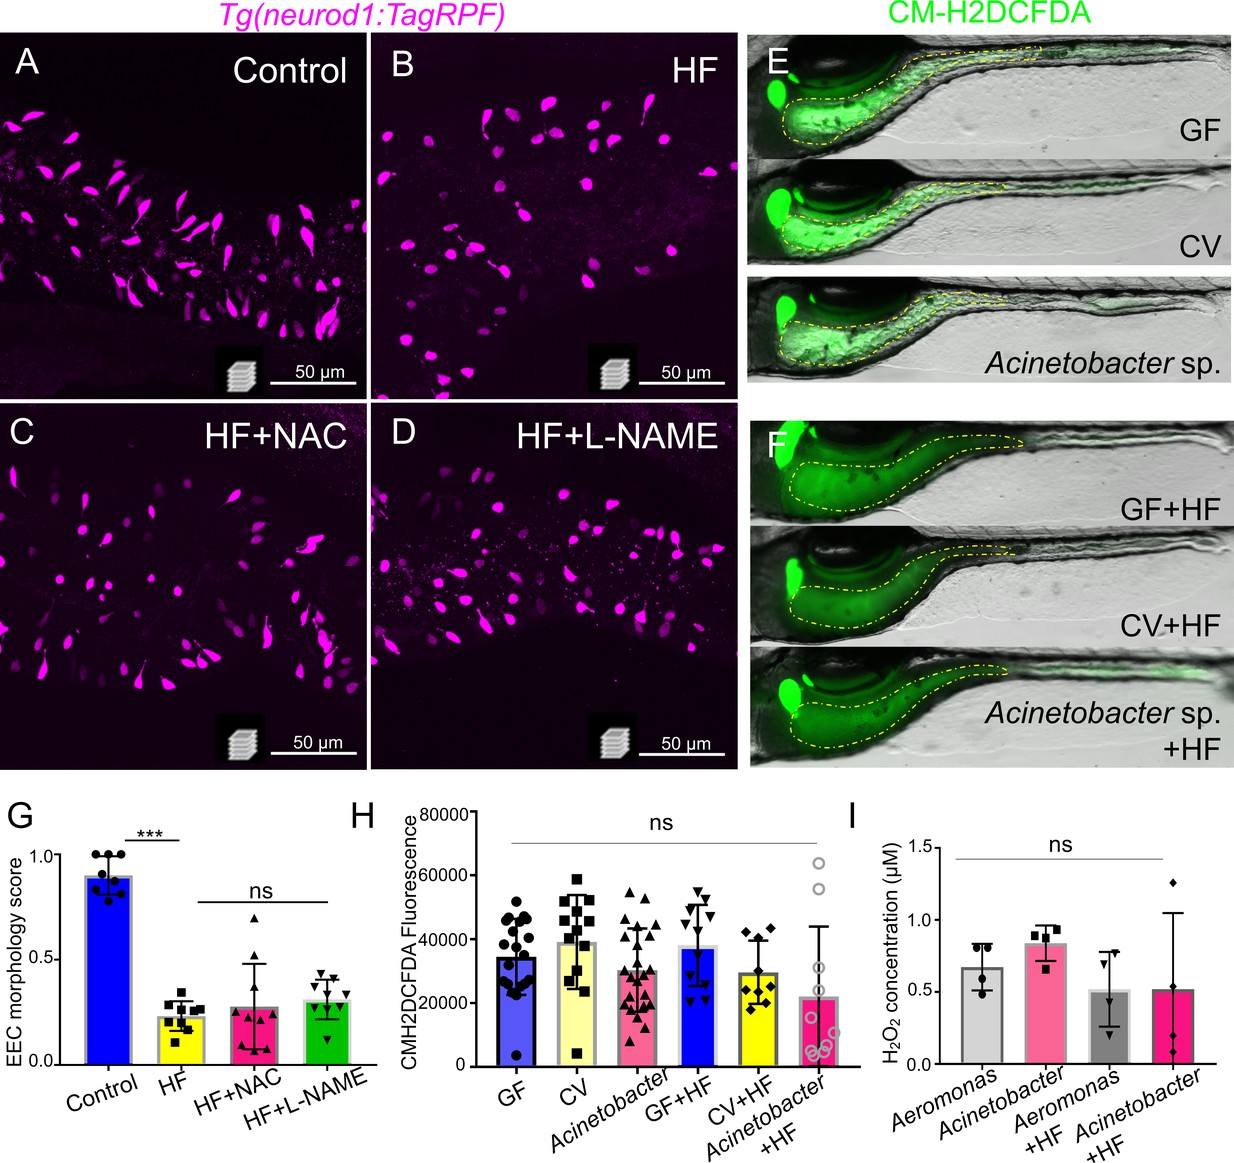
Fig. 9-S3
Inhibition of ROS signaling does not prevent HF feeding induced EEC silencing.
( A–D) Representative confocal projection images of EECs (magenta) in Tg(neurod1:RFP)zebrafish under control conditions, HF feeding, HF feeding with the ROS inhibitor N-acetylcysteine (NAC), and HF feeding with the NOS inhibitor N(gamma)-nitro-L-arginine methyl ester (L-NAME). ( E–F) Representative images of intestines in GF, CV and Acinetobacter sp. ZOR0008 monoassociated control or 6 hr HF fed zebrafish. The intestinal luminal ROS was labeled with CM-H2DCFDA. ( G) Quantification of EEC morphology in control, HF fed, HF fed with NAC or L-NAME treated zebrafish. ( H) Quantification of proximal intestinal lumenal CM-H2DCFDA fluoresence intensity in GF, CV and Acinetobacter sp. monoassociated control or 6 hr HF fed zebrafish. ( I) In vitro measurement of the H2O2 concentration in 1010 CFU Aeromonas sp. ZOR0002 and Acinetobacter sp. ZOR0008 that were cultured in Trypticase Soy Broth or 5% egg yolk in water (HF).