
|
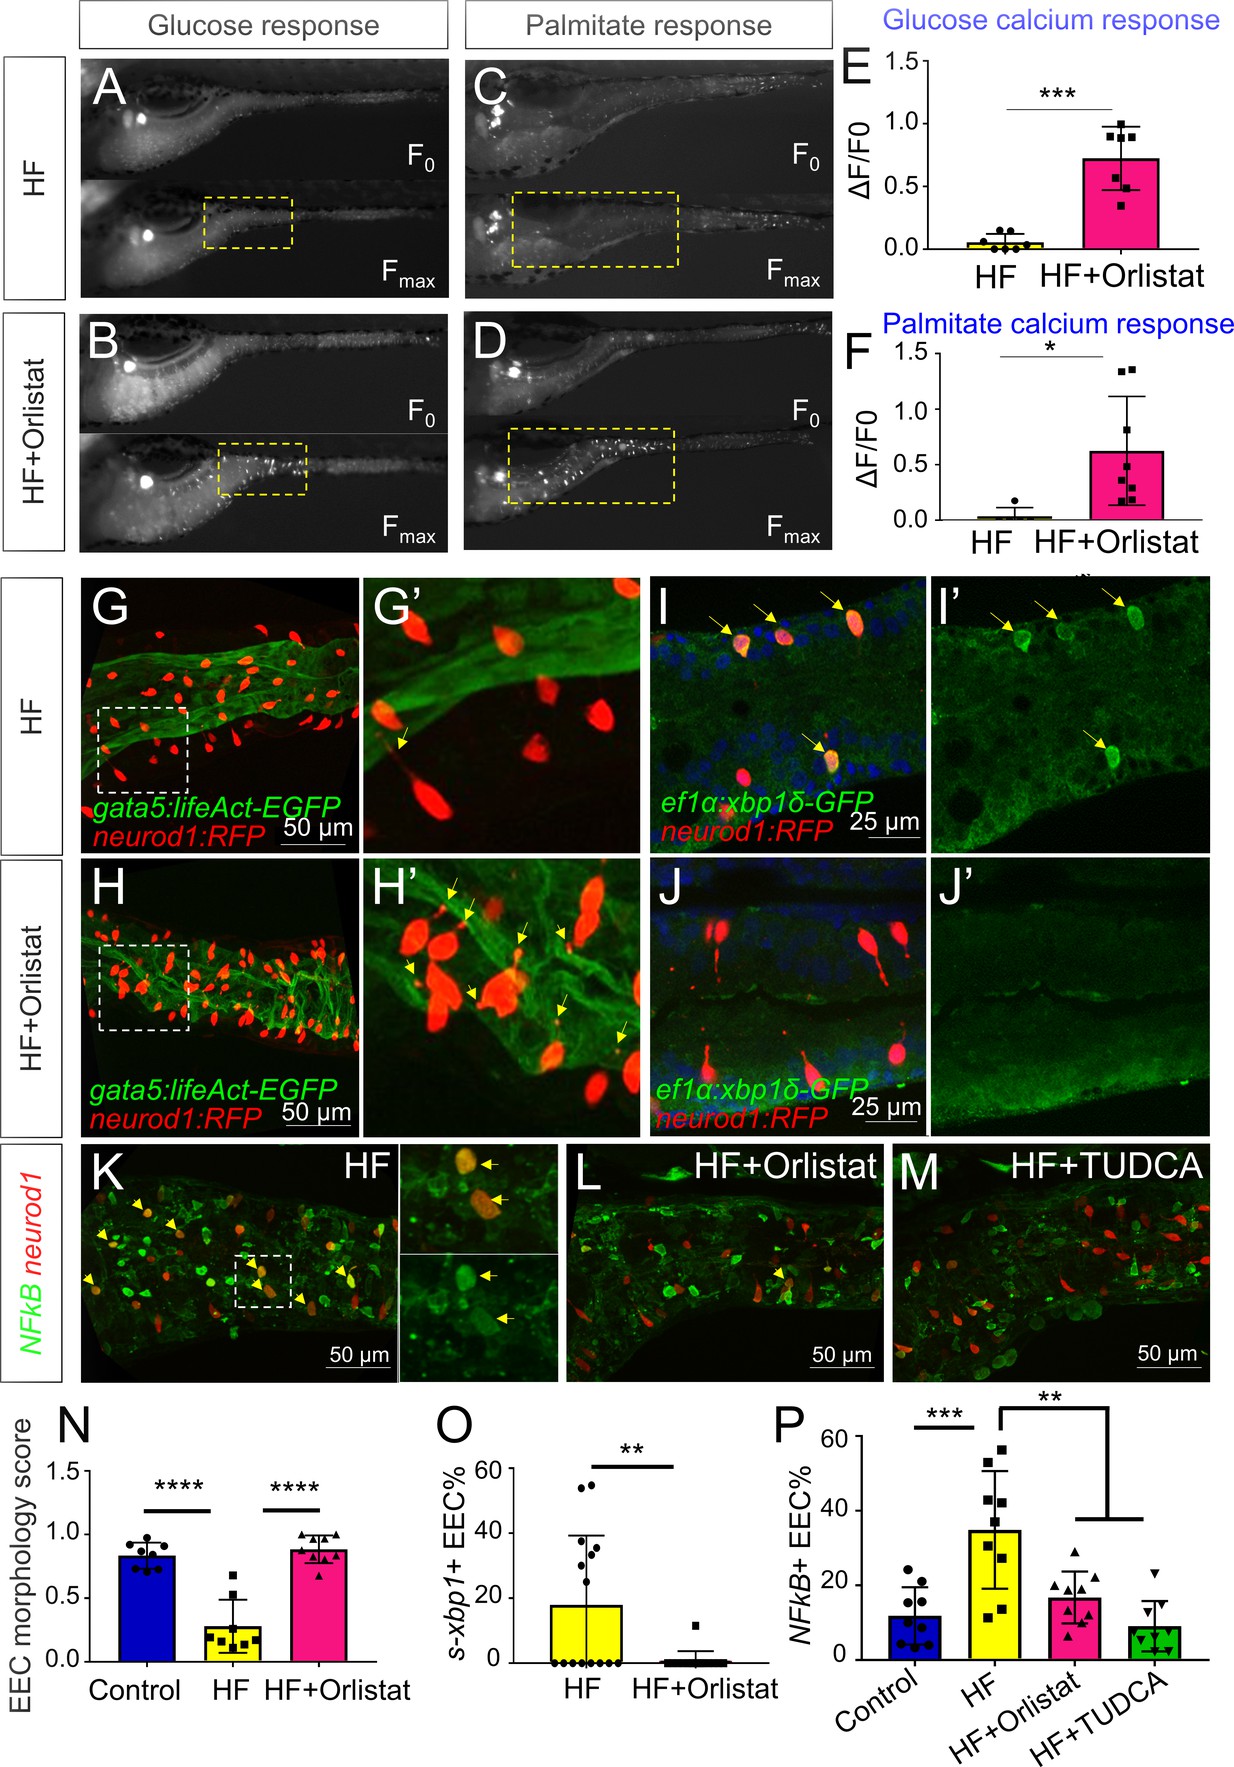
Fig. 7
Orlistat treatment inhibited high fat feeding induced EEC silencing.
( A–D) Representative image of the EEC calcium response to glucose ( A, B) and palmitate ( C, D) stimulation in 6 hr high fat (HF) fed and 6 hr HF fed with 0.5 mM orlistat treated Tg(neurod1:Gcamp6f) zebrafish larvae. ( E, F) Quantification of the EEC calcium response to glucose and palmitate stimulation in 6 hr HF fed and 6 hr HF fed with 0.5 mM orlistat treated zebrafish larvae. ( G–H) Confocal projection of Tg(neurod1:RFP); Tg(gata5:lifeAct-EGFP) zebrafish intestine in 10 hr HF fed larvae ( G) and 10 hr HF fed with 0.1 mM orlistat treated larvae ( H). ( G’–H’) Zoom view of EECs in indicated conditions. The yellow arrows in G’ and H’ indicate the EECs’ apical extensions. ( I–J) Confocal images of Tg(neurod1:RFP); Tg(ef1α:xbp1δ-GFP) zebrafish intestine in 6 hr HF fed larvae ( I) and 6 hr HF fed with 0.5 mM orlistat treated larvae ( J). ( I’–J’) Zoom view of EECs in indicated conditions. Yellow arrows in I’ indicate the EECs with activated xbp1 in HF fed condition. ( K–M) Confocal images of Tg(neurod1:RFP); Tg(NFΚB:EGFP) zebrafish intestine in 10 hr HF fed larvae ( K), 10 hr HF fed larvae treated with 0.1 mM orlistat ( L) and 10 hr HF fed larvae treated with 0.5 mM TUDCA ( M). Yellow arrows indicate neurod1:RFP+ EECs co-labeled with the NFΚB reporter. ( N) Quantification of the EEC morphology score in control, 10 hr HF fed and 10 hr HF fed with 0.1 mM orlistat treated larvae represented in G and H. ( O) Quantification of s-xbp1+ EEC (%) in 6 hr HF fed larvae and 6 hr HF fed larvae treated with 0.5 mM orlistat represented in J and K. ( P) Quantification of NF-κB+ EECs in control, 10 hr HF fed, 10 hr HF fed with 0.1 mM Orlistat and 10 hr HF fed with 0.5 mM TUDCA treated zebrafish larvae represented in K-M. Student t-test was performed in E, F, O and one-way ANOVA with post-hoc Tukey test was used in N, P for statistical analysis. *p<0.05, **p<0.01, ***p<0.001, ****p<0.0001.