
|
Fig. 6-S1
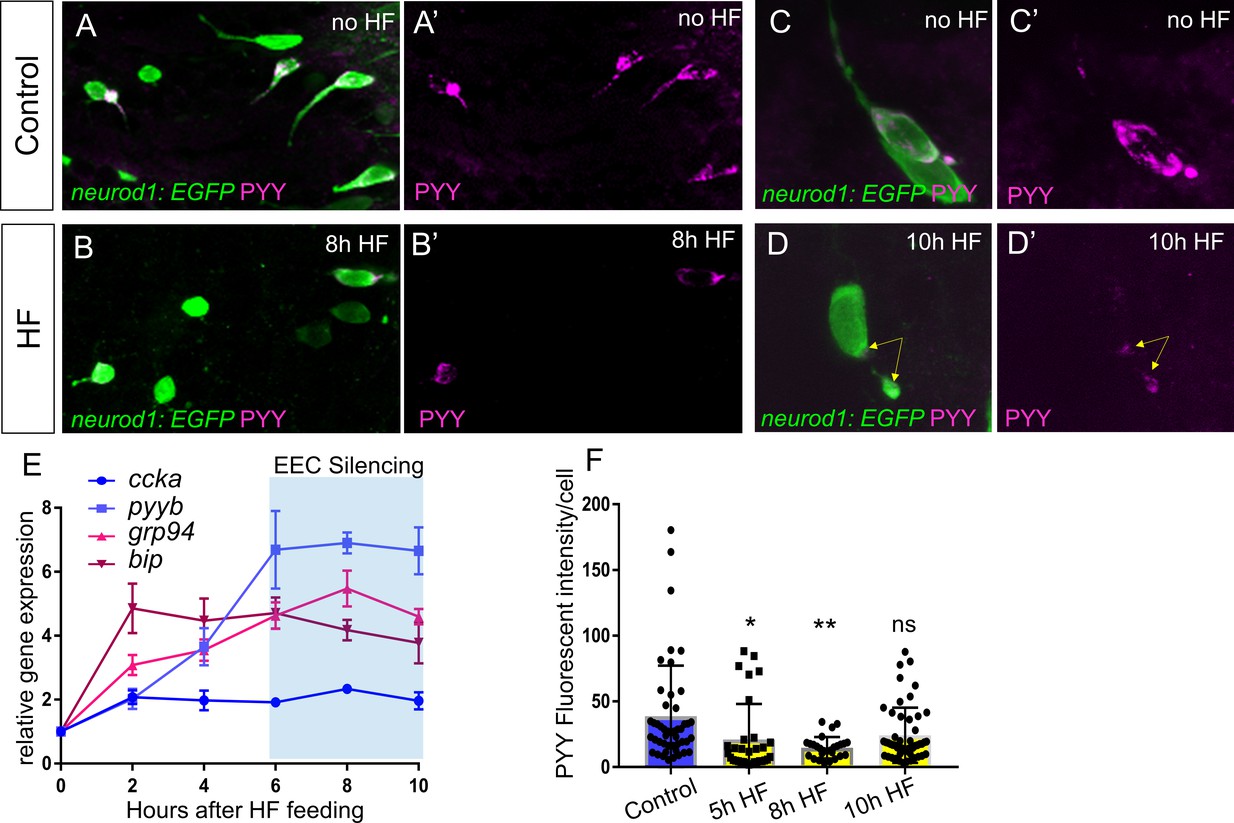
EEC temporal response to HF feeding.
( A–B) Confocoal projections of EECs in control and 8 hr HF fed TgBAC(neurod1:EGFP)zebrafish intestine stained with PYY antibody. ( A’–B’) Confocal projections of PYY+ EECs in control and 8 hr HF fed zebrafish intestine. ( C–D) Zoom view of PYY+ EECs in control and 10 hr HF fed TgBAC(neurod1:EGFP) zebrafish intestines. ( C’–D’) Zoom view of PYY staining in control and 10 hr HF fed zebrafish intestines. Yellow arrows in D’ indicate that in contrast to the control EEC in C’ where PYY staining is distributed in the entire cell, PYY staining in this 10 hr HF fed EEC is only visible at basalateral membrane area. The images in A-D and A’-D’ are taken with the same confocal setting. ( E) Quantitative real-time PCR of ccka, pyyb, grp94 and bip expression from control (n = 4), 2 hr (n = 3), 4 hr (n = 4), 6 hr (n = 4), 8 hr (n = 4) and 10 hr (n = 4) post HF fed zebrafish digestive tracts. ( F) Quantification of PYY+ cell fluorescence intensity from control (47 cells from six fish), 5 hr (33 cells from seven fish), 8 hr (27 cells from six fish) and 10 hr (51 cells from eight fish) post HF fed zebrafish intestine. One-way ANOVA with post-hoc Tukey test was used in F for statistical analysis. *p<0.05, **p<0.01.