
|
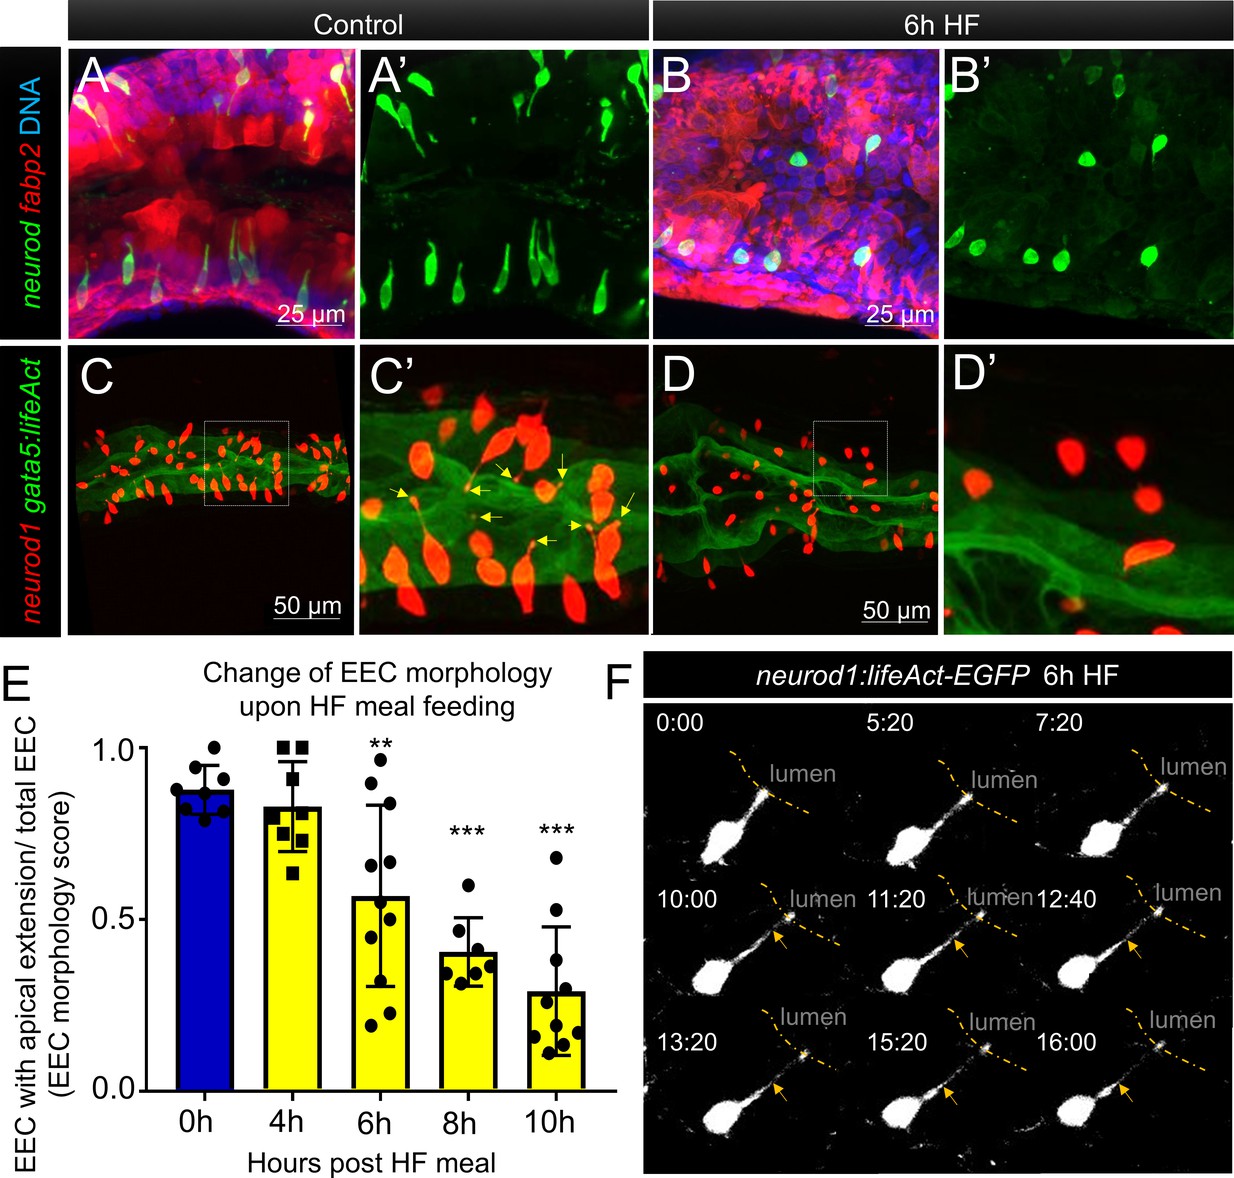
Fig. 4
Enteroendocrine cells lose their apical extensions following high fat feeding.
( A–B) Confocal projection of 6 dpf zebrafish intestine in control ( A) and 6 hr high fat (HF) fed larvae ( B). Enteroendocrine cells (EECs) are marked by TgBAC(neurod1:EGFP) and enterocytes are marked by Tg(fabp2:DsRed). ( A’–B’) Subpanel images of neurod1+EECs in control larvae ( A’) and 6 hr after high fat feeding ( B’). ( C–D) Confocal projection of 6 dpf zebrafish intestine in control ( C) and 6 hr high fat fed larvae ( D).The enteroendocrine cells are marked by Tg(neurod1:RFP) and the apical region of intestine cells are marked by Tg(gata5:lifeAct-EGFP). ( C’–D’) Zoom view of EECs in control ( C’) and HF fed larvae ( D’). Note that in control intestine, the EECs have extensions that touch the apical lumen (yellow arrow in C’). Such apical extensions in EECs are lost following high fat meal feeding ( D, D’). ( E) Quantification of EEC morphology in control and 4–10 hr HF fed zebrafish larvae in Tg(gata5:lifeAct-EGFP);Tg(neurod1:RFP) double transgenic zebrafish. The EEC morphology score is defined as the ratio of the number of EECs with apical extensions over the number of total EECs. ( F) Time lapse images showing loss of the EEC apical extension in 6 hr HF fed larvae using Tg(neurod1:lifeAct-EGFP). One-way ANOVA with post-hoc Tukey test was used in E for statistical analysis. **p<0.01, ***p<0.001.