
Fig. 1
- ID
- ZDB-IMAGE-200327-1
- Publication
- Tiraboschi et al., 2020 - New insights into the early mechanisms of epileptogenesis in a zebrafish model of Dravet syndrome
- All Figures
- Figures for Tiraboschi et al., 2020
|
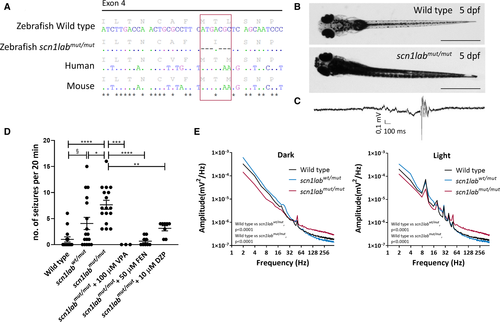
Fig. 1
Development of scn1labmut/mut zebrafish model by CRISPR/Cas9 technique and its characterization. A, Amino acid and nucleotide sequence of scn1lab in zebrafish wild type (WT) and scn1labmut/mut, and orthologues in human ( SCN1A) and mouse ( Scn1a). Dots indicate identical nucleotides, dashes indicate deletions, and stars indicate identical nucleotides in all four sequences. B, WT and scn1labmut/mut larvae at 5 days postfertilization (dpf). Increased pigmentation is observed in mutants. Scale bars = 1 mm. C, Example of local field potential (LFP) recording obtained from the scn1labmut/mut tectum at 5 dpf, showing a seizure event with preictal and ictal phase. D, scn1labmut/mut larvae at 5 dpf show an increased number of seizures over a 20‐minute period compared to WT larvae or scn1labwt/mut siblings. A low number of seizures were observed in WT larvae, likely caused by needle insertion into the optic tectum. scn1labwt/mut displayed a larger number of seizures on average than WT larvae, but more interindividual variability was observed, with some larvae displaying no seizures, whereas others were affected to the same extent as homozygous larvae. No significant difference in the number of seizures was observed between WT larvae and scn1labmut/mutlarvae treated with valproic acid (VPA), fenfluramine (FEN), or diazepam (DZP), indicating efficacy of these drugs in reducing the number of seizures to background levels. Significance was calculated using one‐way analysis of variance with Tukey post hoc test (* P < .05, ** P < .01, *** P < .001, **** P < .0001) or unpaired, two‐tailed t test (§ P < .05). E, Power spectrum analyses of LFP recordings performed under dark conditions, or under a 10‐Hz flashing light stimulus. The energy profile of scn1labmut/mut larvae differs significantly from WT and scn1labwt/mut siblings in both conditions. A Kolmogorov‐Smirnov test was used to calculate significance