
|
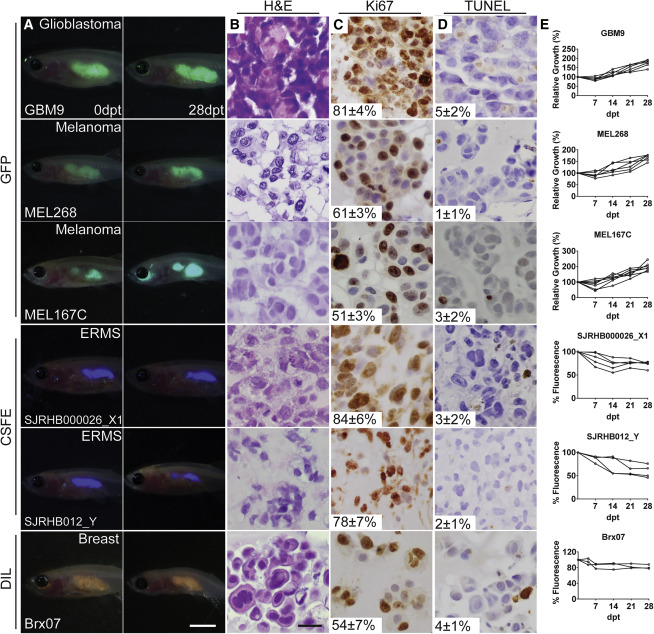
Fig. 2 Prkdc−/−, il2rga−/− Zebrafish Engraft Patient-Derived Tumors Merged fluorescence and brightfield images of prkdc−/−, il2rga−/− zebrafish imaged at 0 and 28 days post transplant (dpt) (A). Hematoxylin- and eosin-stained sections (B) and immunohistochemistry for Ki67 (C) and TUNEL (D) with the average percentage of positive cells ± standard deviation noted (n ≥ 3 fish/tumor type). Quantification of relative growth of transplanted cells over time (E). Note that Viafluor- and DiL-labeled cells would not be predicted to increase intensity with time, as 100% fluorescence equates to full retention of tumor cells over the experiment. Scale bar represents 0.25 cm (A); 50 μm (B–D).
Reprinted from Cell, 177(7), Yan, C., Brunson, D.C., Tang, Q., Do, D., Iftimia, N.A., Moore, J.C., Hayes, M.N., Welker, A.M., Garcia, E.G., Dubash, T.D., Hong, X., Drapkin, B.J., Myers, D.T., Phat, S., Volorio, A., Marvin, D.L., Ligorio, M., Dershowitz, L., McCarthy, K.M., Karabacak, M.N., Fletcher, J.A., Sgroi, D.C., Iafrate, J.A., Maheswaran, S., Dyson, N.J., Haber, D.A., Rawls, J.F., Langenau, D.M., Visualizing Engrafted Human Cancer and Therapy Responses in Immunodeficient Zebrafish, 1903-1914.e14, Copyright (2019) with permission from Elsevier. Full text @ Cell