
|
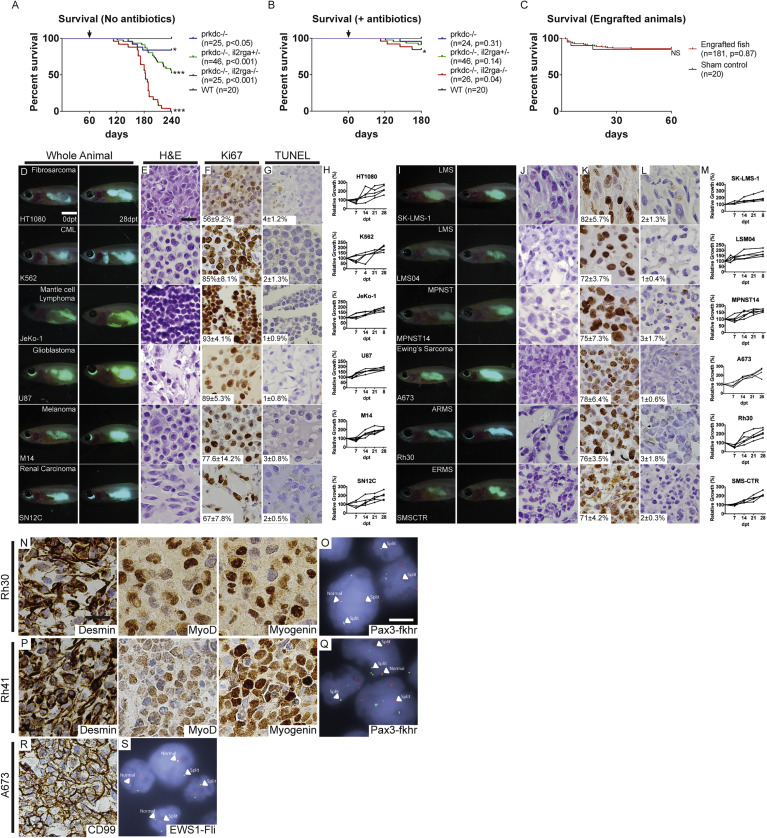
Fig. S1 Survival Analysis and Xenograft Engraftment of prkdc−/−, il2rga−/− Zebrafish, Related to Figure 1 Kaplan-Meier survival analysis for prkdc−/−, il2rga−/− zebrafish that were genotyped by scale resection at 60 to 90 days of life and then returned directly to system water without antibiotic treatment and grown at 28.5°C (A) or grown in isolated 4L tanks supplemented with antibiotics and reared at 37°C (B). Kaplan-Meier survival analysis for prkdc−/−, il2rga−/− fish that were injected with sham control or human cancer cells and grown at 37°C in our recirculating system supplemented with antibiotics (C, n = 155 of 181 engrafted animals survived to 60 dpt). ∗p < 0.05 and ∗∗∗p<0.001, log rank test. Not significant (NS). Representative merged fluorescence and brightfield images of EGFP+ human cancers grown in prkdc−/−, il2rga−/− zebrafish (D and I). Images shown at 0 dpt (left, D and I) and 28 dpt (right, D and I), respectively. Hematoxylin- and eosin-stained sections of engrafted tumors (E and J). Ki67 immunohistochemistry (F and K), and TUNEL (G and L) with the average percentage of positive cells ± standard deviation noted (n ≥ 3 fish/tumor type). Quantification of relative growth of EGFP+ human cancer cells successfully engrafted into individual prkdc−/−, il2rga−/− zebrafish (H and M). Tumor type is noted in upper right in leftmost panels (D) and (I) and cell line name in lower left. Chronic myeloid leukemia (CML), leiomyosarcoma (LMS), malignant peripheral nerve sheath tumor (MPNST), embryonal rhabdomyosarcoma (ERMS), and alveolar rhabdomyosarcoma (ARMS). Scale bar represents 0.25 cm (D and I); 50 μm (E–G and J–L). Immunohistochemistry for expression of clinical diagnostic makers and pathognomonic gene fusions in xenografted Rh30 ARMS (N and O), Rh41 ARMS (P and Q), and A673 Ewing’s sarcoma (R and S). Diagnostic fluorescent in situ hybridization (FISH) for FKHR (O and Q) or EWS1 (S). Because probes span the known FKHR or EWS1 genomic breakpoints, split break apart denotes translocation. Scale bars represent 50 μm (N, P, and R) and 5μm (O, Q, and S).
Reprinted from Cell, 177(7), Yan, C., Brunson, D.C., Tang, Q., Do, D., Iftimia, N.A., Moore, J.C., Hayes, M.N., Welker, A.M., Garcia, E.G., Dubash, T.D., Hong, X., Drapkin, B.J., Myers, D.T., Phat, S., Volorio, A., Marvin, D.L., Ligorio, M., Dershowitz, L., McCarthy, K.M., Karabacak, M.N., Fletcher, J.A., Sgroi, D.C., Iafrate, J.A., Maheswaran, S., Dyson, N.J., Haber, D.A., Rawls, J.F., Langenau, D.M., Visualizing Engrafted Human Cancer and Therapy Responses in Immunodeficient Zebrafish, 1903-1914.e14, Copyright (2019) with permission from Elsevier. Full text @ Cell