IMAGE

Figure 5

ID
ZDB-IMAGE-200325-90
Source
Figures for Sarasamma et al., 2020
Image
Figure Caption

Figure 5

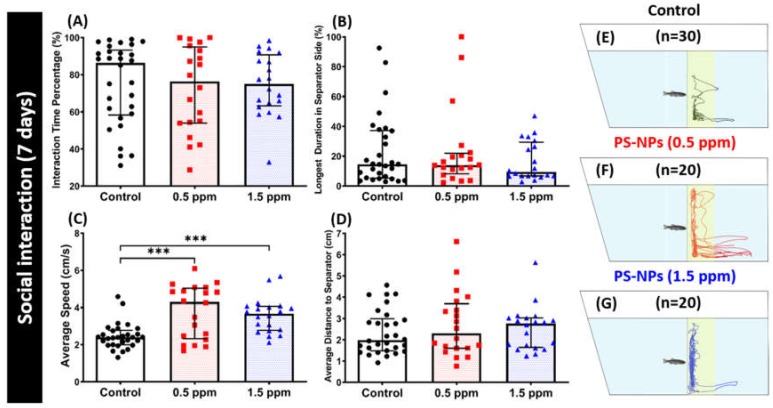
Social interaction behavior endpoints comparisons between control and polystyrene nanoplastics (PS-NPs)-exposed zebrafish groups after a ~7-day exposure. (A) Interaction time percentage, (B) longest duration in the separator, (C) average speed, and (D) average distance to separator side were analyzed for social interaction assay. The 1 min. locomotion trajectories for the control, 0.5 and 1.5 ppm PS-NPs exposed fish in mirror biting tests were presented in E, F, G, respectively with the yellow-colored zone as the conspecific interaction region. The data are expressed as the median with interquartile range and were analyzed by a Kruskal-Wallis test, which continued with Dunn’s multiple comparisons test as a follow-up test (n = 30 for control; n = 20 for each PS-NPs-exposed group).

Acknowledgments
This image is the copyrighted work of the attributed author or publisher, and ZFIN has permission only to display this image to its users. Additional permissions should be obtained from the applicable author or publisher of the image. Full text @ Int. J. Mol. Sci.