
Image
|
Figure Caption
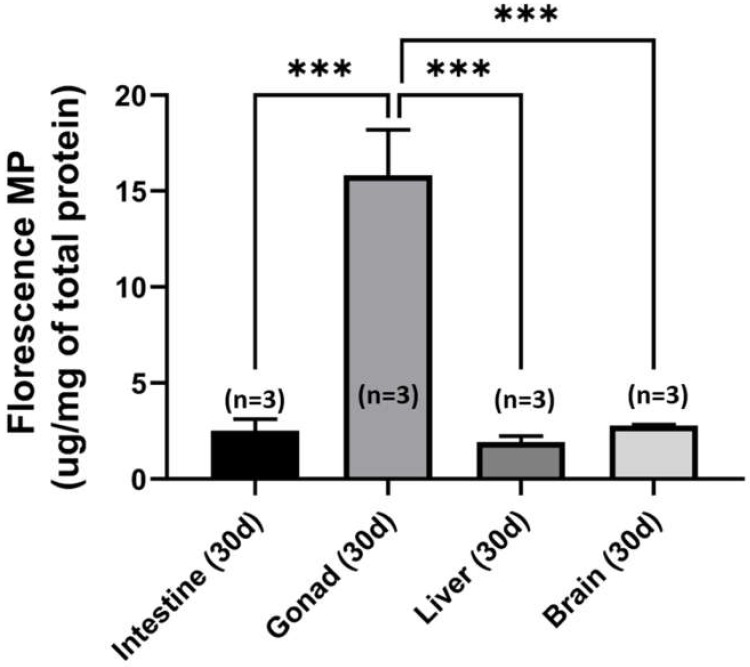
Figure 8
Comparison of the tissue distribution of green fluorescence-labeled nanoplastics among different tissues in zebrafish after ~30 days of polystyrene nanoplastics (PS-NPs) exposure. The data are expressed as the mean ± SEM and they were analyzed by One-way ANOVA, which continued with post hoc analysis (
Acknowledgments
This image is the copyrighted work of the attributed author or publisher, and
ZFIN has permission only to display this image to its users.
Additional permissions should be obtained from the applicable author or publisher of the image.
Full text @ Int. J. Mol. Sci.