
|
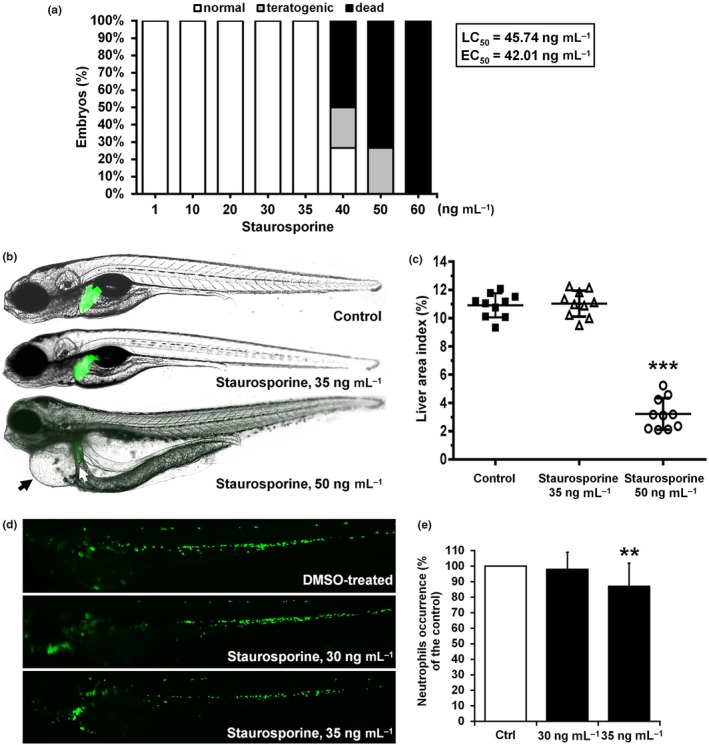
Figure 4
Toxicity assessment of staurosporine in the zebrafish model. (a) The dose‐dependent survival/teratogenicity, (b, c) cardio‐ and hepatotoxicity, and (d, e) myelotoxicity are shown. At a staurosporine dose of 50 ng/ml, embryos were seriously affected, showing large pericardial edema (solid arrow), reduced and damaged liver (white arrow) and whole‐body edema (b). The changes in the liver area index assessed in 120‐hr old zebrafish embryos were not observed between DMSO‐treated (Control) and staurosporine‐treated embryos (35 ng/ml), contrary to the group upon a dose of 50 ng/ml (c). Staurosporine was not myelotoxic at doses up to 35 ng/ml, while at 35 ng/ml, it caused weak neutropenia in the treated zebrafish embryos, as detected at 72 hpf. *