
Fig. 3
- ID
- ZDB-IMAGE-200323-7
- Publication
- Hernandez et al., 2019 - Tmem2 restricts atrioventricular canal differentiation by regulating degradation of hyaluronic acid
- All Figures
- Figures for Hernandez et al., 2019
|
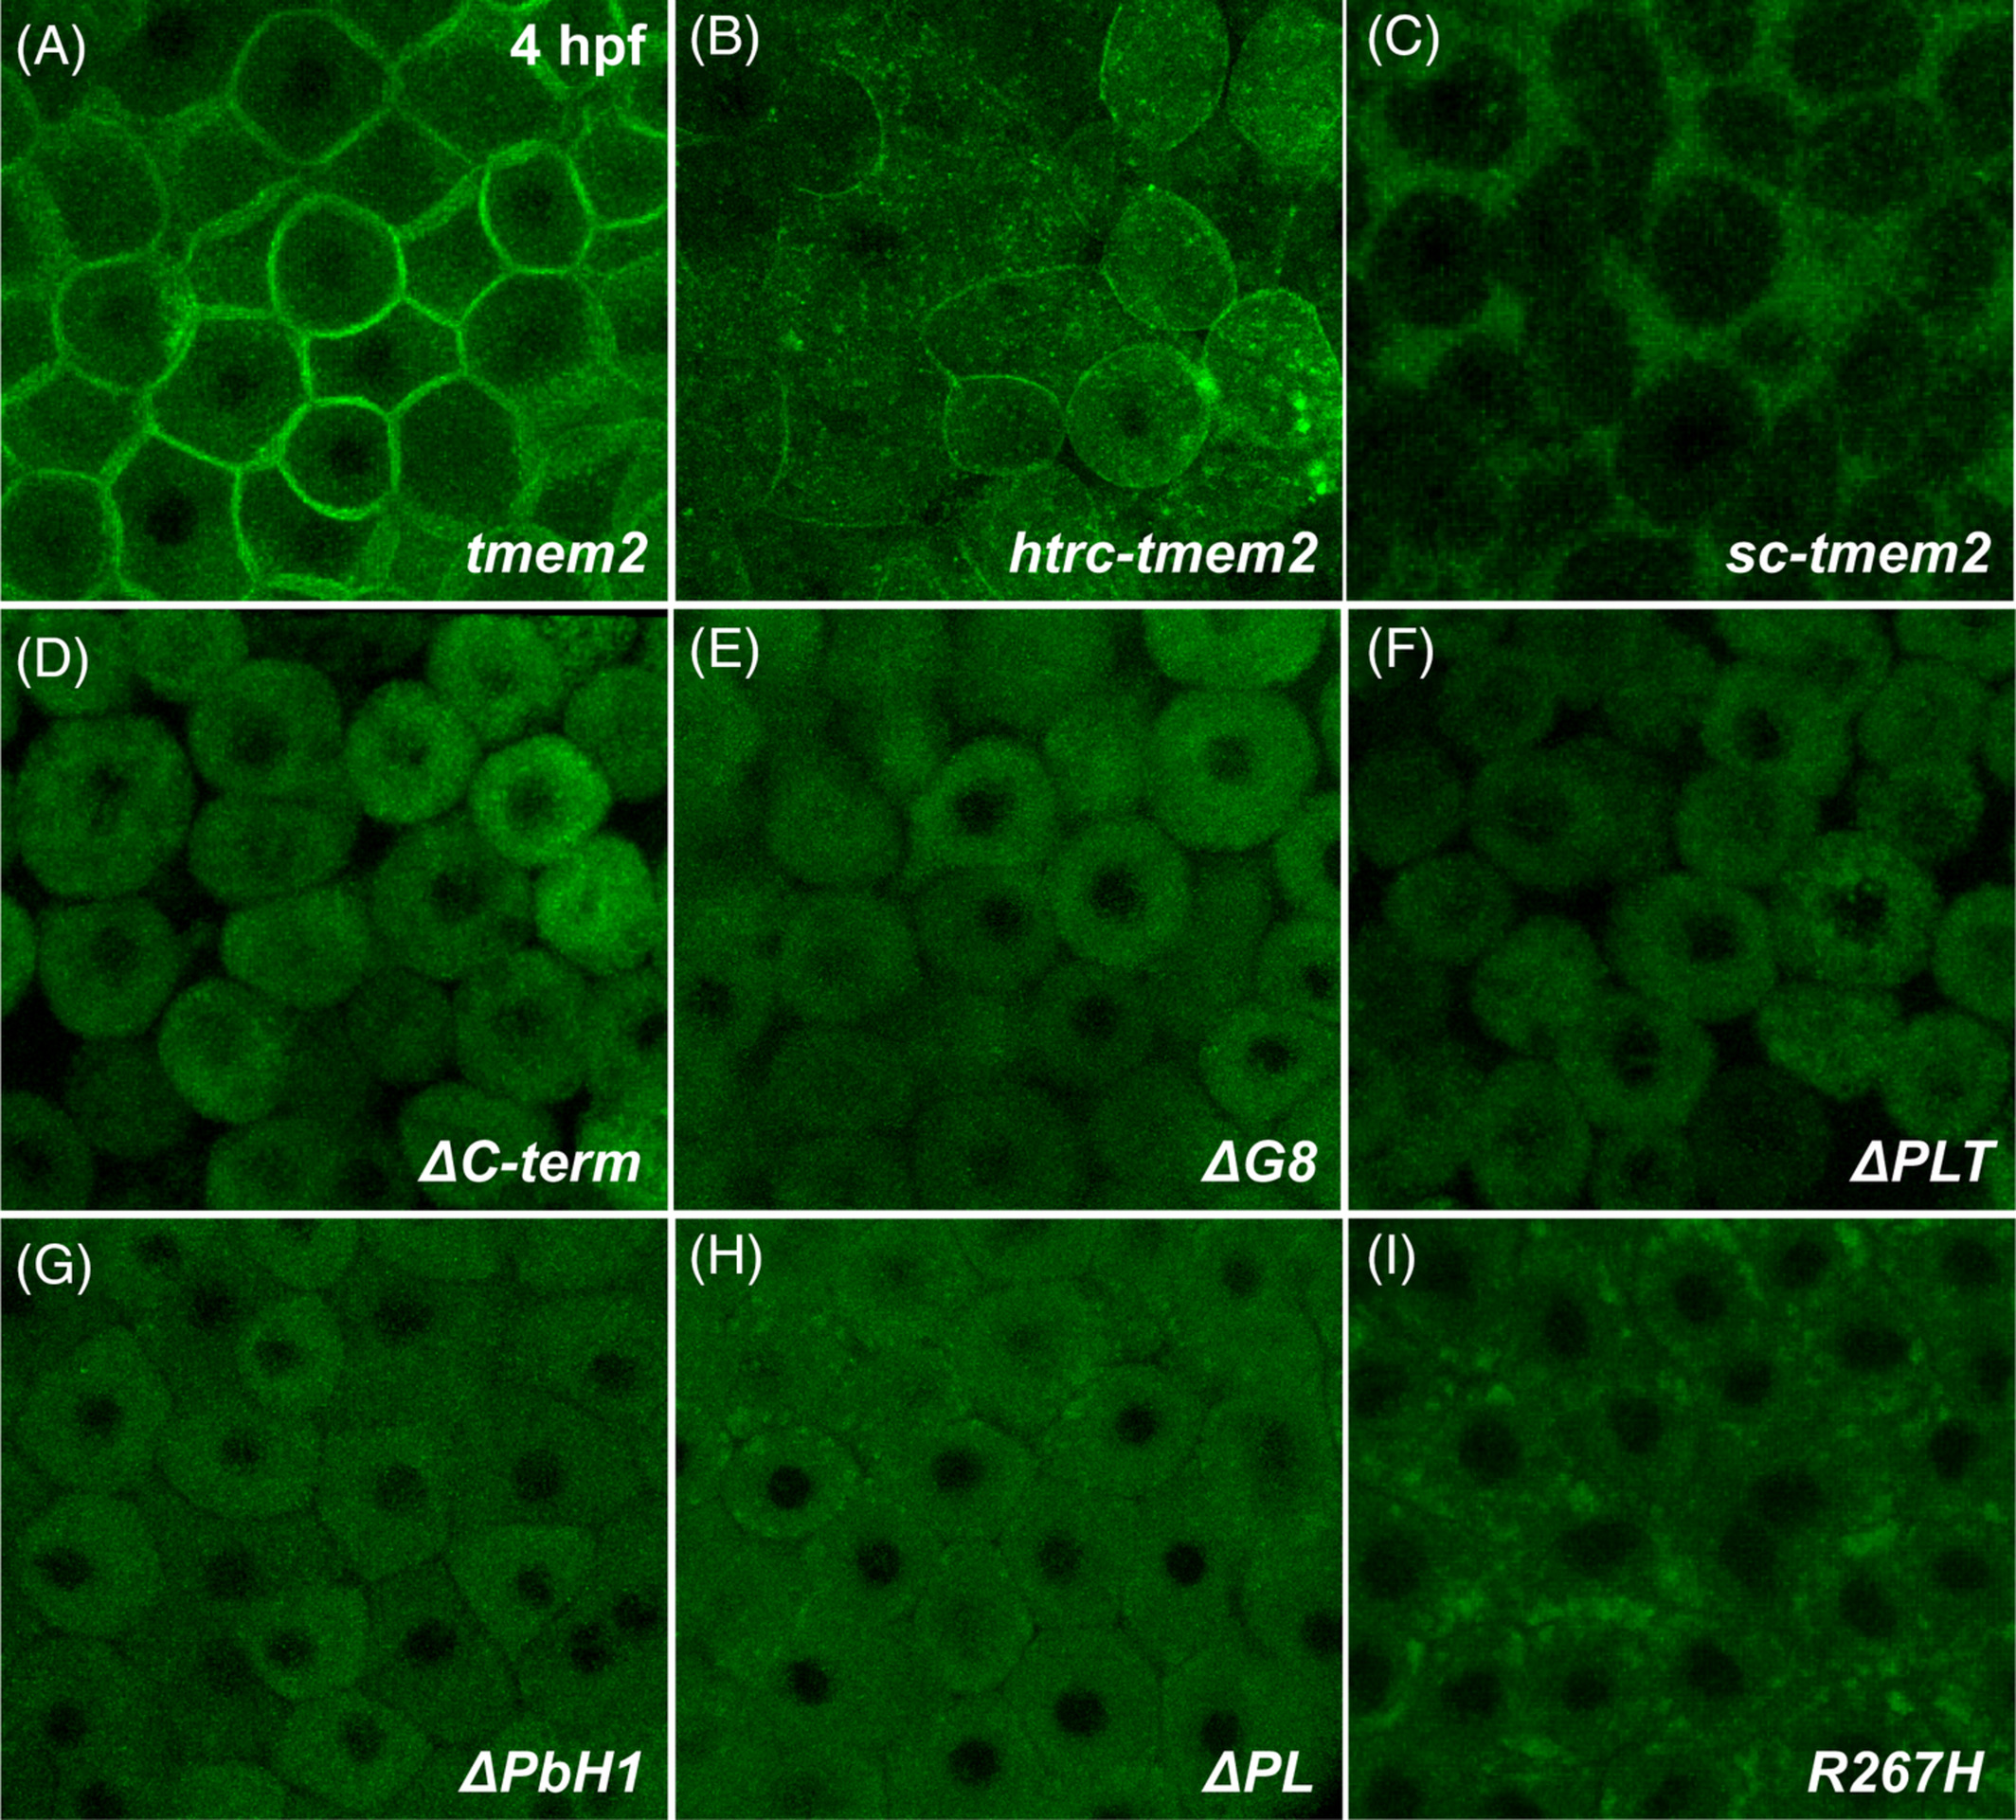
Fig. 3 Subcellular localization of Tmem2 and Tmem2 variants in zebrafish blastomeres. Confocal reconstructions depict a lateral portion of the live zebrafish blastula at 4 hpf, following injection with mRNA encoding Tmem2‐GFP (A) or its variants (B‐I); the large size and optical accessibility of blastomeres are ideal for analysis of GFP localization. Full‐length Tmem2 and Htrc‐Tmem2 are both found at the plasma membrane (A, B). In contrast, Sc‐Tmem2 appears to traffic to the extracellular environment (C), while blastomere membranes remain intact (data not shown). All variants without extracellular domains lack evident membrane localization and, instead, display primarily cytoplasmic localization (D‐H). The R267H variant is also not apparent at the plasma membrane, yet its localization is distinct in that it is found in clusters within the cell (I). Although other variants are occasionally found in similar clusters (eg, H), they are especially prominent and frequently observed for R267H (I). Sample sizes were: tmem2, n = 12; htrc‐tmem2, n = 11; sc‐tmem2, n = 9; ΔC‐term, n = 10; ΔG8, n = 8; ΔPLT, n = 9; ΔPbH1, n = 10; ΔPL, n = 8; R267H, n = 16