
Fig. 1
- ID
- ZDB-IMAGE-200320-1
- Publication
- Chou et al., 2018 - Ribose-5-Phosphate Isomerase A Overexpression Promotes Liver Cancer Development in Transgenic Zebrafish via Activation of ERK and β-catenin Pathways
- All Figures
- Figures for Chou et al., 2018
|
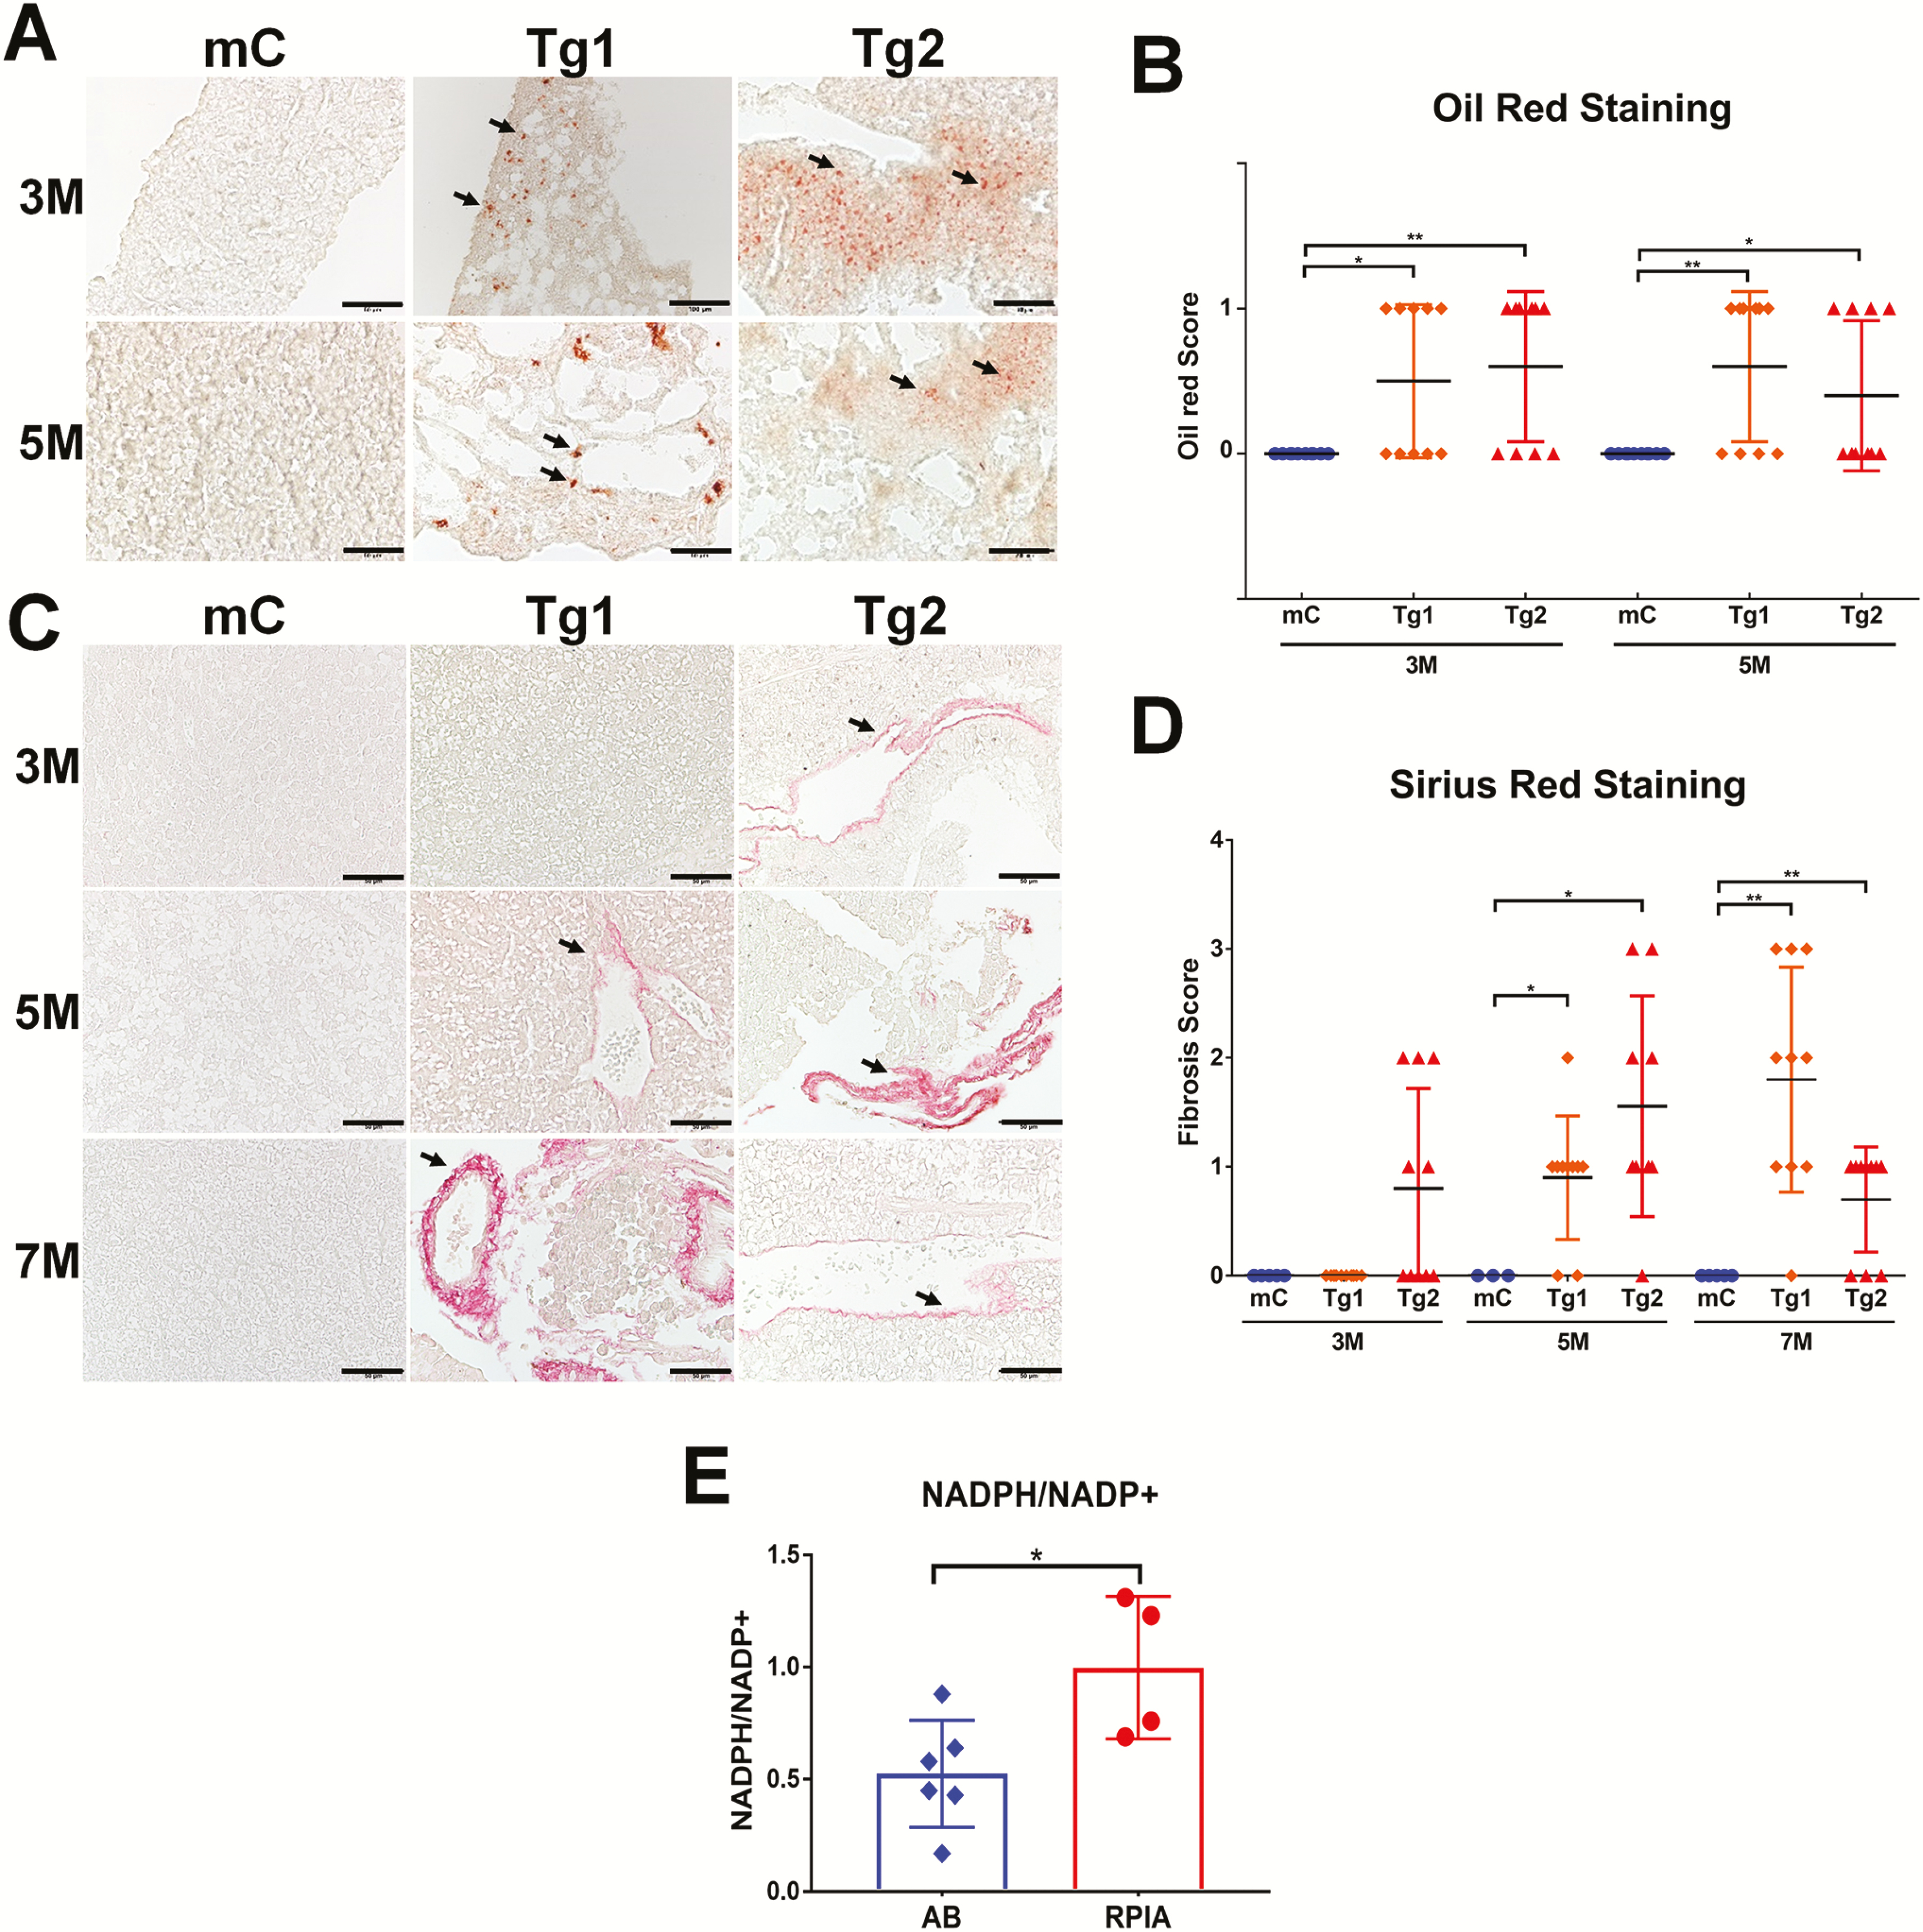
Fig. 1 Steatosis and fibrosis develop in RPIA-transgenic zebrafish. (A) Representative pictures of Oil Red O staining results from liver tissues of 3- and 5-month-old control (fabp10a: EGFP-mCherry, mC) and two Tg (fabp10a: RPIA) lines (Tg1 and Tg2) magnified ×400. Scale bar: 50 μm. (B) Statistical analysis of the Oil Red O staining results for the 3- and 5-month-old RPIA Tg 1 (orange diamond) and Tg2 (red triangle) compared with the control fish (mC, blue). Ten fish from each group were analyzed. (C) Representative image of Sirius Red staining results of the 3- to 7- month-old control (mC) and two RPIA-transgenic fish (Tg1 and Tg2). Control fish exhibited no staining while 7-month-old Tg1 fish and 5-month-old Tg2 fish displayed positive signs of fibrosis, which are shown in red. All of the magnifications were ×400. Scale bar: 50 μm (D) Statistical analysis of the Sirius Red staining results for the 3-, 5- and 7-month-old RPIA Tg 1 (orange diamond) and Tg2 (red triangle) compared with the control fish (mC, blue). (E) The ratio of NADPH/NADP+ was elevated in 5-month-old RPIA-transgenic zebrafish. P < 0.05 was considered to be statistically significant; *: 0.01 < P ≤ 0.05.