
|
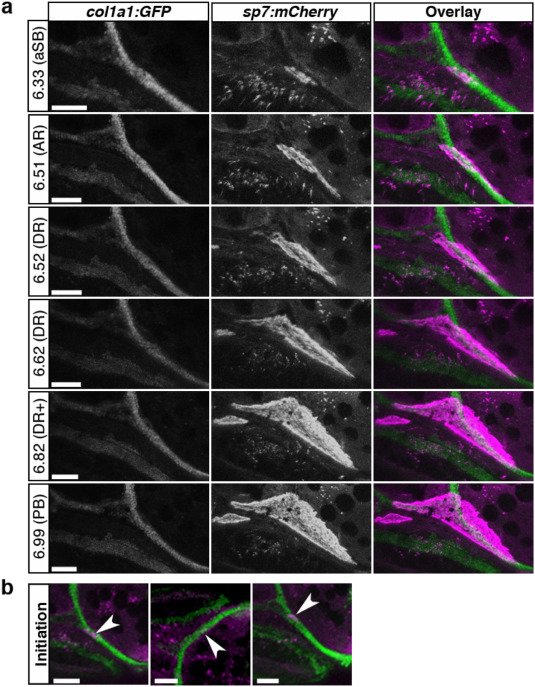
Fig. 2 Confocal imaging of frontal bone initiation. (a) High magnification fluorescent imaging of live Tg(col1a1:egfp; sp7:mcherry) zebrafish illustrates close association of bone initiation with cartilage. Each set of panels represents maximum projections of z-stacks, separate GFP and mCherry channels and the overlay. Beside each panel, the standard length (SL) in mm is listed, with the developmental staging in parentheses, according to Parichy et al. (2009). At 6.33 mm SL the first osteoblasts are seen in close proximity with TMP. Bone growth initiates along TMP before crossing EPB and continuing along TMA. Frontal bone begins planar growth away from cartilage at 6.82 mm SL. (b) Examples from three individual fish illustrate initiation of frontal bone on either left or right side (arrowheads). Abbreviations: anterior swim bladder appearance (aSB); anal fin ray appearance (AR); dorsal fin ray appearance (DR); pelvic fin bud appearance (PB). Scale bars = 100 μm.
Reprinted from Mechanisms of Development, 160, Kanther, M., Scalici, A., Rashid, A., Miao, K., Van Deventer, E., Fisher, S., Initiation and early growth of the skull vault in zebrafish, 103578, Copyright (2019) with permission from Elsevier. Full text @ Mech. Dev.