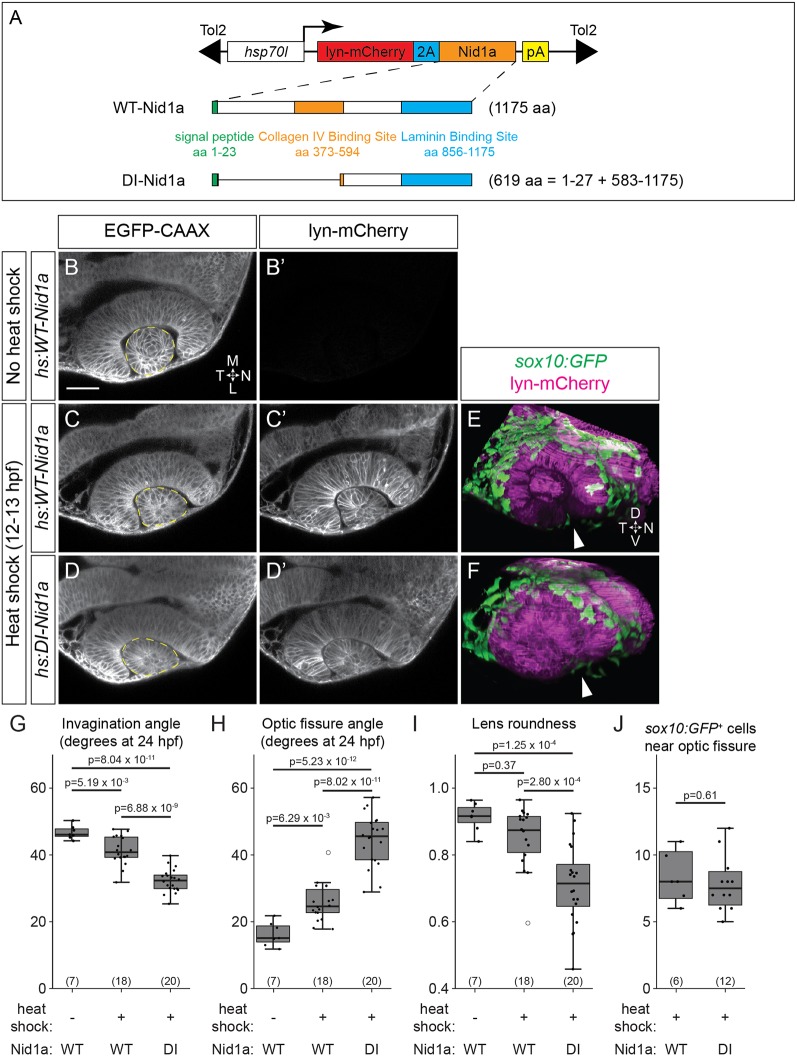
Dominant-interfering nidogen disrupts optic cup morphogenesis. (A) Schematics of full length (WT) and dominant-interfering (DI) zebrafish nidogen 1a and transgene constructs. (B-D′) Tg(bactin2:EGFP-CAAX) transgenics also carrying either hs:WT-Nid1a (B-C′) or hs:DI-Nid1a (D,D′) transgenes. Control embryos (B), not heat shocked, are lyn-mCherry− (B′); experimental embryos were heat shocked at 12-13 hpf (C-D′). Dorsal view, single confocal sections. (E,F) Tg(sox10:GFP)+;hs:WT-Nid1a (E) or hs:DI-Nid1a (F) transgenics heat shocked at 12-13 hpf. GFP+ neural crest cells migrate around the optic cup and into the optic fissure (arrowheads) in both conditions. Lateral view, 3D renderings, 24 hpf. (G-J) Quantification of invagination angle (G), optic fissure angle (H), lens roundness (I) and sox10:GFP+ cell number at the optic fissure (J). Dashed lines in B-D mark lens outlines used for roundness measurements. sox10:GFP+ cells were counted as near the optic fissure if they were located in the optic fissure or were in contact with a margin of the optic fissure. n (embryos) shown at base of graphs, from one to three experiments. P-values were calculated using one-way ANOVA with Tukey HSD post-hoc test (G-I) or Welch's t-test (J). Scale bar: 50 μm. D, dorsal; L, lateral; M, medial; N, nasal; T, temporal; V, ventral.
This image is the copyrighted work of the attributed author or publisher, and
ZFIN has permission only to display this image to its users.
Additional permissions should be obtained from the applicable author or publisher of the image.
Full text @ Development
Your Input Welcome
Thank you for submitting comments. Your input has been emailed to ZFIN curators who may contact you if
additional information is required.
Oops. Something went wrong. Please try again later.