IMAGE

Figure 5

ID
ZDB-IMAGE-200314-72
Source
Figures for Kang et al., 2020
Image
Figure Caption

Figure 5

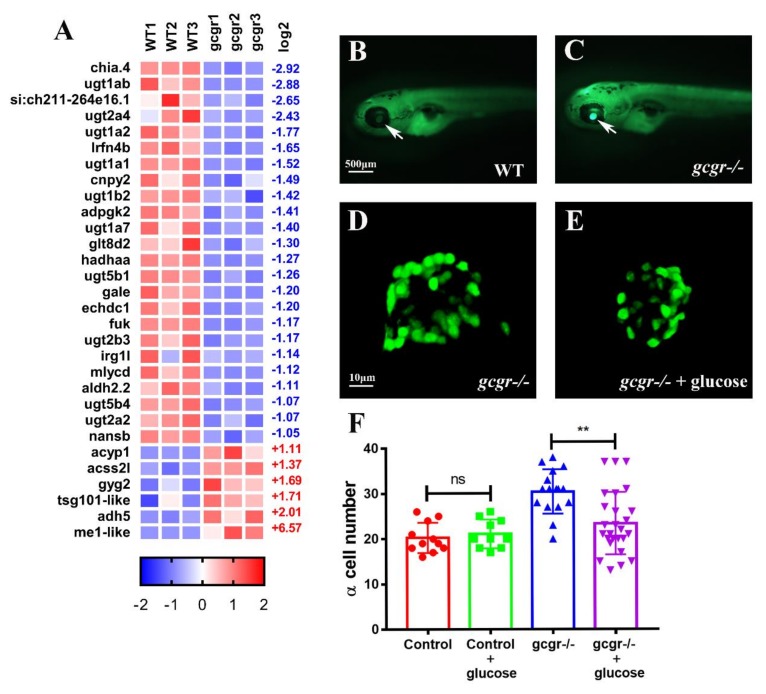
GCGR regulates carbohydrate metabolism in zebrafish larvae. (A) Heatmaps of transcripts in carbohydrate metabolism enrichment. Colors represent high (red), low (blue), or average (white) expression values based on the Z-score normalized FPKM values for each gene. The Z-score indicators are shown under each map. The fold change (log2) are shown on the right. (B,C) 2-NBDG glucose uptake of wildtype (B) and gcgr−/− mutant (C) larvae, the glucose uptake level is indicated by the fluorescence of lens (arrow) imaged by fluorescent microscopy. (D–E) Representative images of the principal islet of gcgr−/−; Tg(gcga:GFP) (D) and 20 mM glucose treated-gcgr−/−; Tg(gcga:GFP) (E). The images are confocal projections; scale bars indicate 10 μm. (F) Quantification of the α-cell number in different groups of zebrafish at 7 dpf, n ≥ 10. Ns: No significance, and ** p < 0.01 by t-test.

Figure Data
Acknowledgments
This image is the copyrighted work of the attributed author or publisher, and ZFIN has permission only to display this image to its users. Additional permissions should be obtained from the applicable author or publisher of the image. Full text @ Int. J. Mol. Sci.