
|
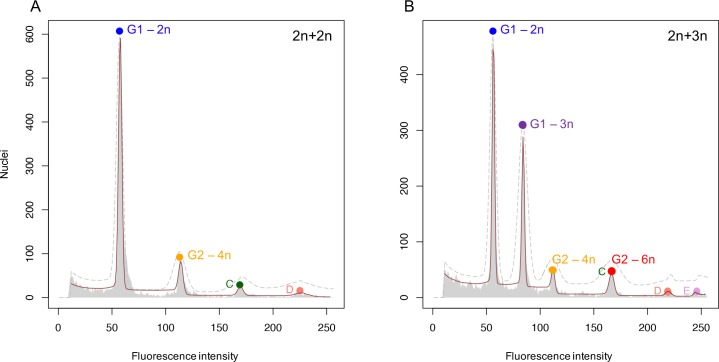
Fig 1
A) Exemplary DNA histogram of two diploid larvae pooled in one sample. Standard size G1-peak = 1.44 pg, estimated size G2-peak = 2.85 pg, ratio G2 / G1 = 1.98, RCS value = 6.96. B) Exemplary DNA histogram of one diploid and one triploid larva pooled in one sample. Standard size G1-peak 2n = 1.44 pg, estimated size G1-peak 3n = 2.15 pg, ratio G1-3n / G1-2n = 1.49, RCS value = 2.11. In both A) and B) the dashed grey line is the initial model estimate and the red line is the fitted model. Colored circles represent matching cell cycle phases derived from a diploid or triploid larva. Peaks C, D, and E represent endopolyploid cell populations.