IMAGE

Fig. 5

ID
ZDB-IMAGE-200311-6
Source
Figures for Farkas et al., 2019
Image
Figure Caption

Fig. 5

Chloride ions entered the pathway but did not pass.
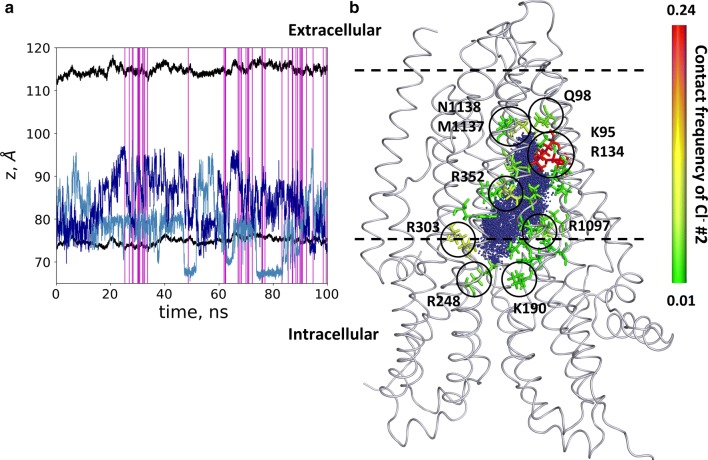
 a The positions of two chloride ions (#1 light blue and #2 blue), entering the protein, are shown by blue lines. Black lines indicate the boundaries of the membrane bilayer determined by the center of mass of P atoms in POPC molecules. Vertical magenta lines mark frames with an open pathway. b The locations of Cl #2 from every frame are shown with blue dots in the context of the initial structure. The contact frequency of this chloride ion with the protein was projected onto the structure and color coded from green (low) to red (high). Residues with the highest interaction frequencies are K95 and R134 (red)

Acknowledgments
This image is the copyrighted work of the attributed author or publisher, and ZFIN has permission only to display this image to its users. Additional permissions should be obtained from the applicable author or publisher of the image. Full text @ Cell. Mol. Life Sci.