
Image
|
Figure Caption
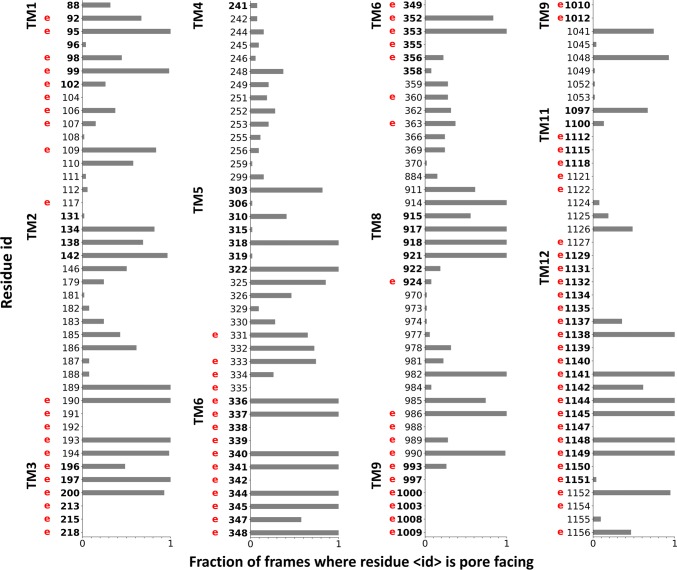
Fig. 2
Comparing channel-lining residues identified in simulations to experimental data. Residues interacting with the Caver spheres were counted from all open frames (
Acknowledgments
This image is the copyrighted work of the attributed author or publisher, and
ZFIN has permission only to display this image to its users.
Additional permissions should be obtained from the applicable author or publisher of the image.
Full text @ Cell. Mol. Life Sci.