IMAGE

FIGURE 7

ID
ZDB-IMAGE-200306-80
Source
Figures for Schredelseker et al., 2020
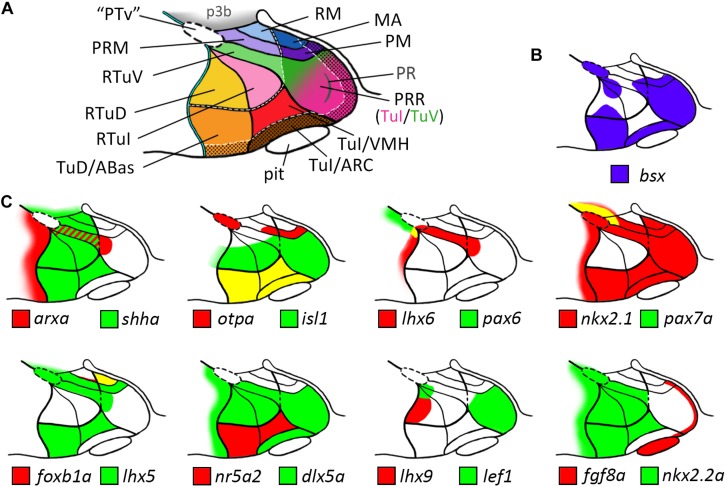
Image
Figure Caption

FIGURE 7

Schematic representations of gene expression patterns in subdomains of the basal hypothalamus. (A) Schematic of a representative intermediate sagittal optical section highlighting all subdomains of the basal hypothalamus identified in this study. The alar-basal boundary is shown as thin cyan line with black border. White hatched lines indicate transverse boundaries between the peduncular and terminal hypothalamus as well as between the terminal (solid colors) and acroterminal (shown with black dotted overlay pattern) domains. The green/pink hatched gradient fill area indicates the mixed TuV- and TuI-like characteristics of the PRR (see main text for details). (B,C) Expression patterns of (B)bsx in purple and (C) other genes in red and green as indicated within the subdomains of the basal hypothalamus as depicted in (A), yellow indicates overlapping expression. The red-green hatched area in (C) indicates expression at different sagittal levels, thus no colocalization. Abbreviations see list.

Acknowledgments
This image is the copyrighted work of the attributed author or publisher, and ZFIN has permission only to display this image to its users. Additional permissions should be obtained from the applicable author or publisher of the image. Full text @ Front. Neuroanat.