IMAGE

Fig. 4

ID
ZDB-IMAGE-200306-18
Source
Figures for Lee et al., 2020
Image
Figure Caption

Fig. 4

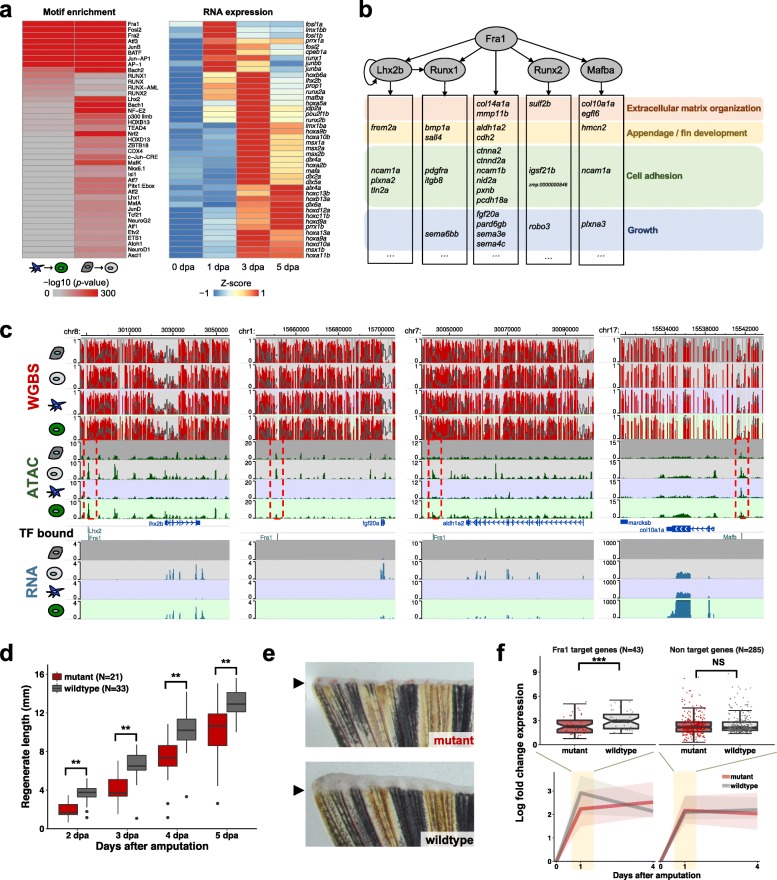
Gene regulatory networks identify upstream factors for fin regeneration. a Heatmaps showing the enriched TF binding motifs in DARs that gained accessibility in sp7+ and sp7− cells during fin regeneration (left) and of RNA expression of the corresponding TF genes (right). Motifs were sorted by binomial p value of enrichment in sp7+ cells. TF genes were clustered by their expression levels. b Putative gene regulatory network of the fin regeneration. The gray ovals are TFs whose motifs were highly enriched in DARs that gained accessibility during regeneration. The genes in the bottom boxes are the target genes of Fra1 and/or other TFs, identified by the footprint analysis. These target genes have biological functions relevant during fin regeneration as shown on the right. c Example Epigenome Browser views of Fra1, Lhx2, or Mafb motifs found in DARs, with their nearby target genes. Red dashed boxes indicate DARs that gained accessibility during regeneration. Motifs predicted to be bound by TFs were shown. d Boxplot showing fin regenerate lengths as a function of the time after amputation. Mutant (fosl1atw4/tw4) zebrafish (red) showed delayed regeneration after fin amputation compared to their wildtype littermates (gray). **p < 0.01; Mann–Whitney U test. e Representative pictures of the fin regenerate from the mutant (fosl1atw4/tw4) and their wildtype (fosl1a+/+) littermates at 2 dpa. Arrowhead, amputation plane. f RNA expression levels of the Fra1 target genes and non-target genes in the mutant (fosl1atw1/tw1) and their wildtype littermates. The predicted target genes of Fra1 were not upregulated as highly in mutant fish as in wildtype at 1 dpa (left), consistent with the delayed regeneration phenotype. Upregulated genes that were not Fra1 targets showed statistically no difference in the level of gene expression changes (right). Top boxplots show gene expression fold changes at 1 dpa. Bottom line plots show median gene expression fold changes across genes (line) in the time course. Shaded areas represent 25% and 75% quantiles. ***p < 0.001; Wilcoxon signed-rank test

Figure Data
Acknowledgments
This image is the copyrighted work of the attributed author or publisher, and ZFIN has permission only to display this image to its users. Additional permissions should be obtained from the applicable author or publisher of the image. Full text @ Genome Biol.