
Image
|
Figure Caption
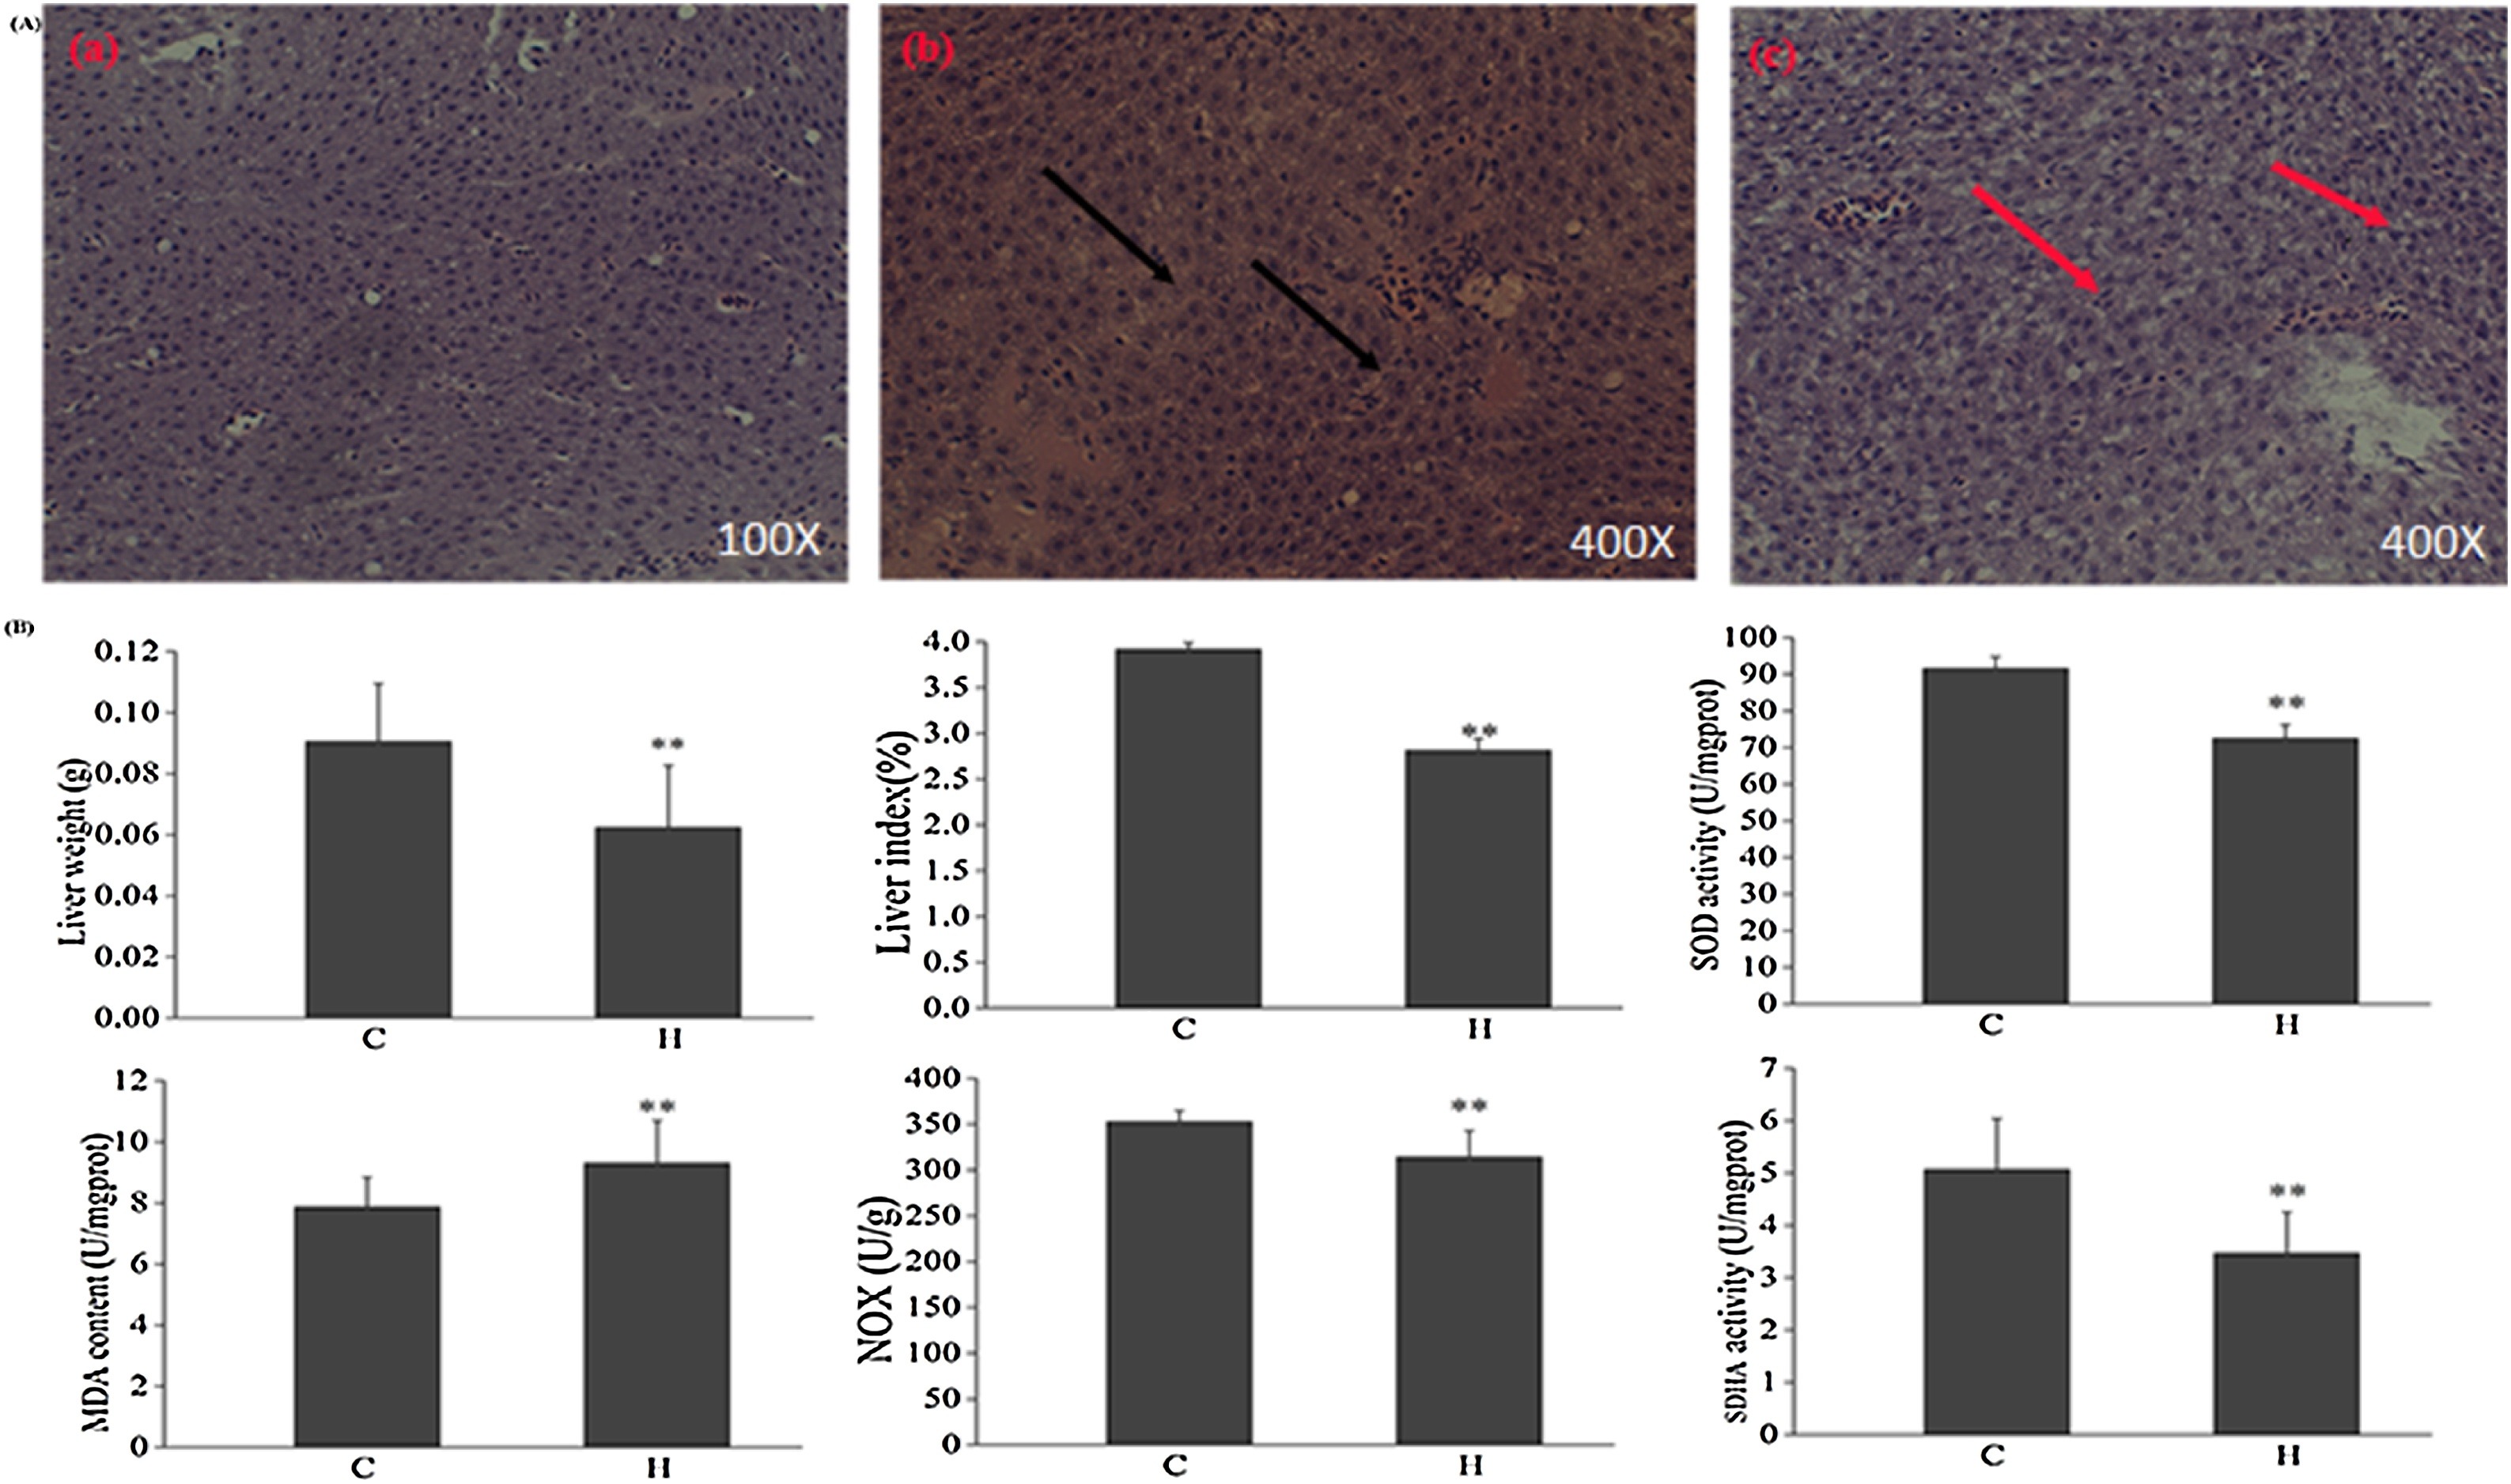
Fig. 1
(A) H&E sections of livers from control (a. 100X) and Rhizoma Paridis-treated adult zebrafish (b,c. 400X). The red arrows indicated necrosisn and the black arrow indicated cell vacuolation. (B) Tissue SOD, SDH, NOX enzyme activity, and MDA level from control and treated zebrafish.
Acknowledgments
This image is the copyrighted work of the attributed author or publisher, and
ZFIN has permission only to display this image to its users.
Additional permissions should be obtained from the applicable author or publisher of the image.
Full text @ Biomed. Pharmacother.