
Fig. 1
- ID
- ZDB-IMAGE-200306-104
- Genes
- Publication
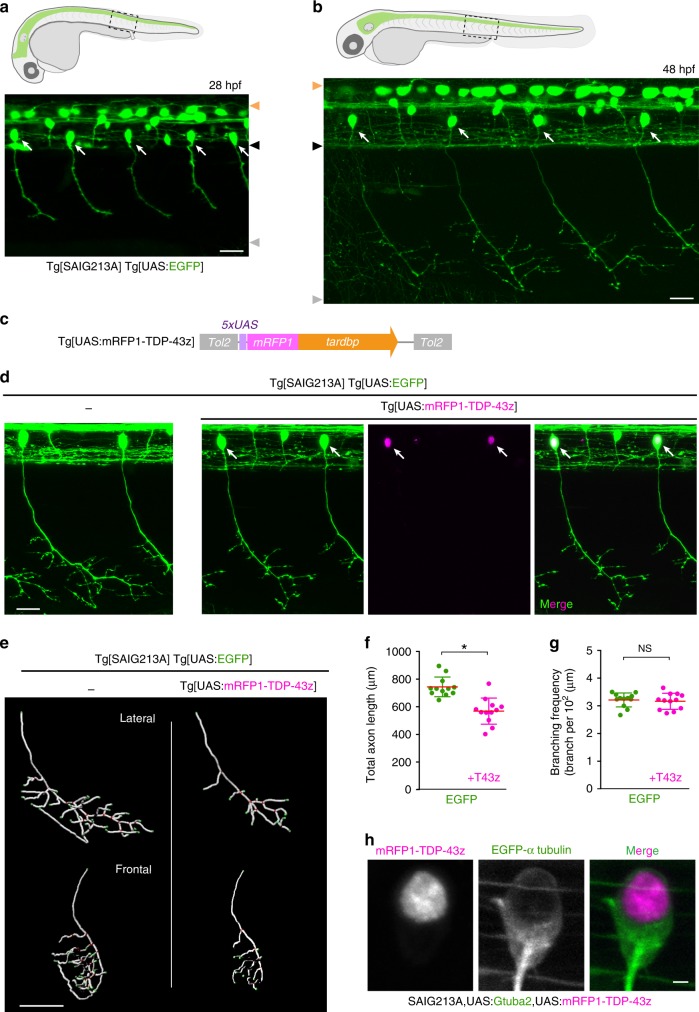
- Asakawa et al., 2020 - Optogenetic modulation of TDP-43 oligomerization accelerates ALS-related pathologies in the spinal motor neurons
- All Figures
- Figures for Asakawa et al., 2020
|
Fig. 1