IMAGE

Figure 4

ID
ZDB-IMAGE-200306-102
Source
Figures for Moreira et al., 2020
Image
Figure Caption

Figure 4

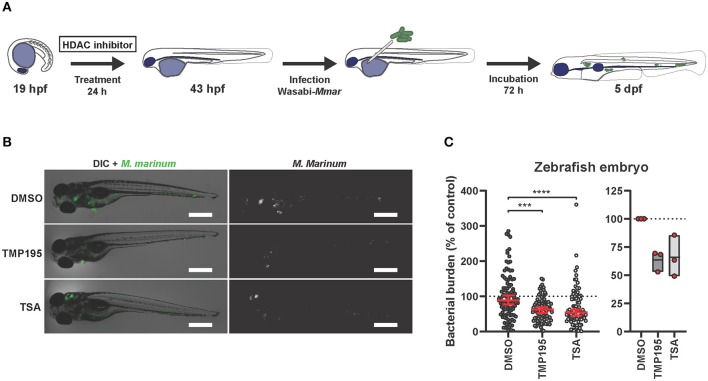
Zebrafish embryos exposed to HDAC inhibitors display reduced bacterial burden. (A) Outline of the experimental setup used in (B,C). (B) Zebrafish embryos were at the 20 somite stage [19 h post fertilization (hpf)], exposed to TMP195 (10 μM), TSA (30 nM), or DMSO at equal v/v for 24 h. Embryos were subsequently infected by microinjection of 250–300 CFU Mycobacterium marinum (Mmar) expressing Wasabi fluorescent protein, into the Duct of Cuvier. Shown are representative infected larvae of each treatment group imaged for Mmar fluorescence at 3 days post infection. Scale bar indicates 500 μm. (C) Indicated is bacterial burden of all zebrafish larvae (left) or each independent experiment (right). Graphs represent zebrafish larvae from different parent couples used in 3 independent experiments, and treated with TMP195 (n = 92), TSA (n = 90), or DMSO at equal v/v (n = 102) expressed as a percentage of the DMSO control. Each dot indicates an embryo with horizontal line and whiskers in red representing median with 95% confidence intervals (left) or each dot indicates the mean of a single experiment with floating bars representing min. to max. while the horizontal line represents the mean of the 3 independent experiments (***p < 0.001; ****p < 0.0001).

Acknowledgments
This image is the copyrighted work of the attributed author or publisher, and ZFIN has permission only to display this image to its users. Additional permissions should be obtained from the applicable author or publisher of the image. Full text @ Front Immunol