
|
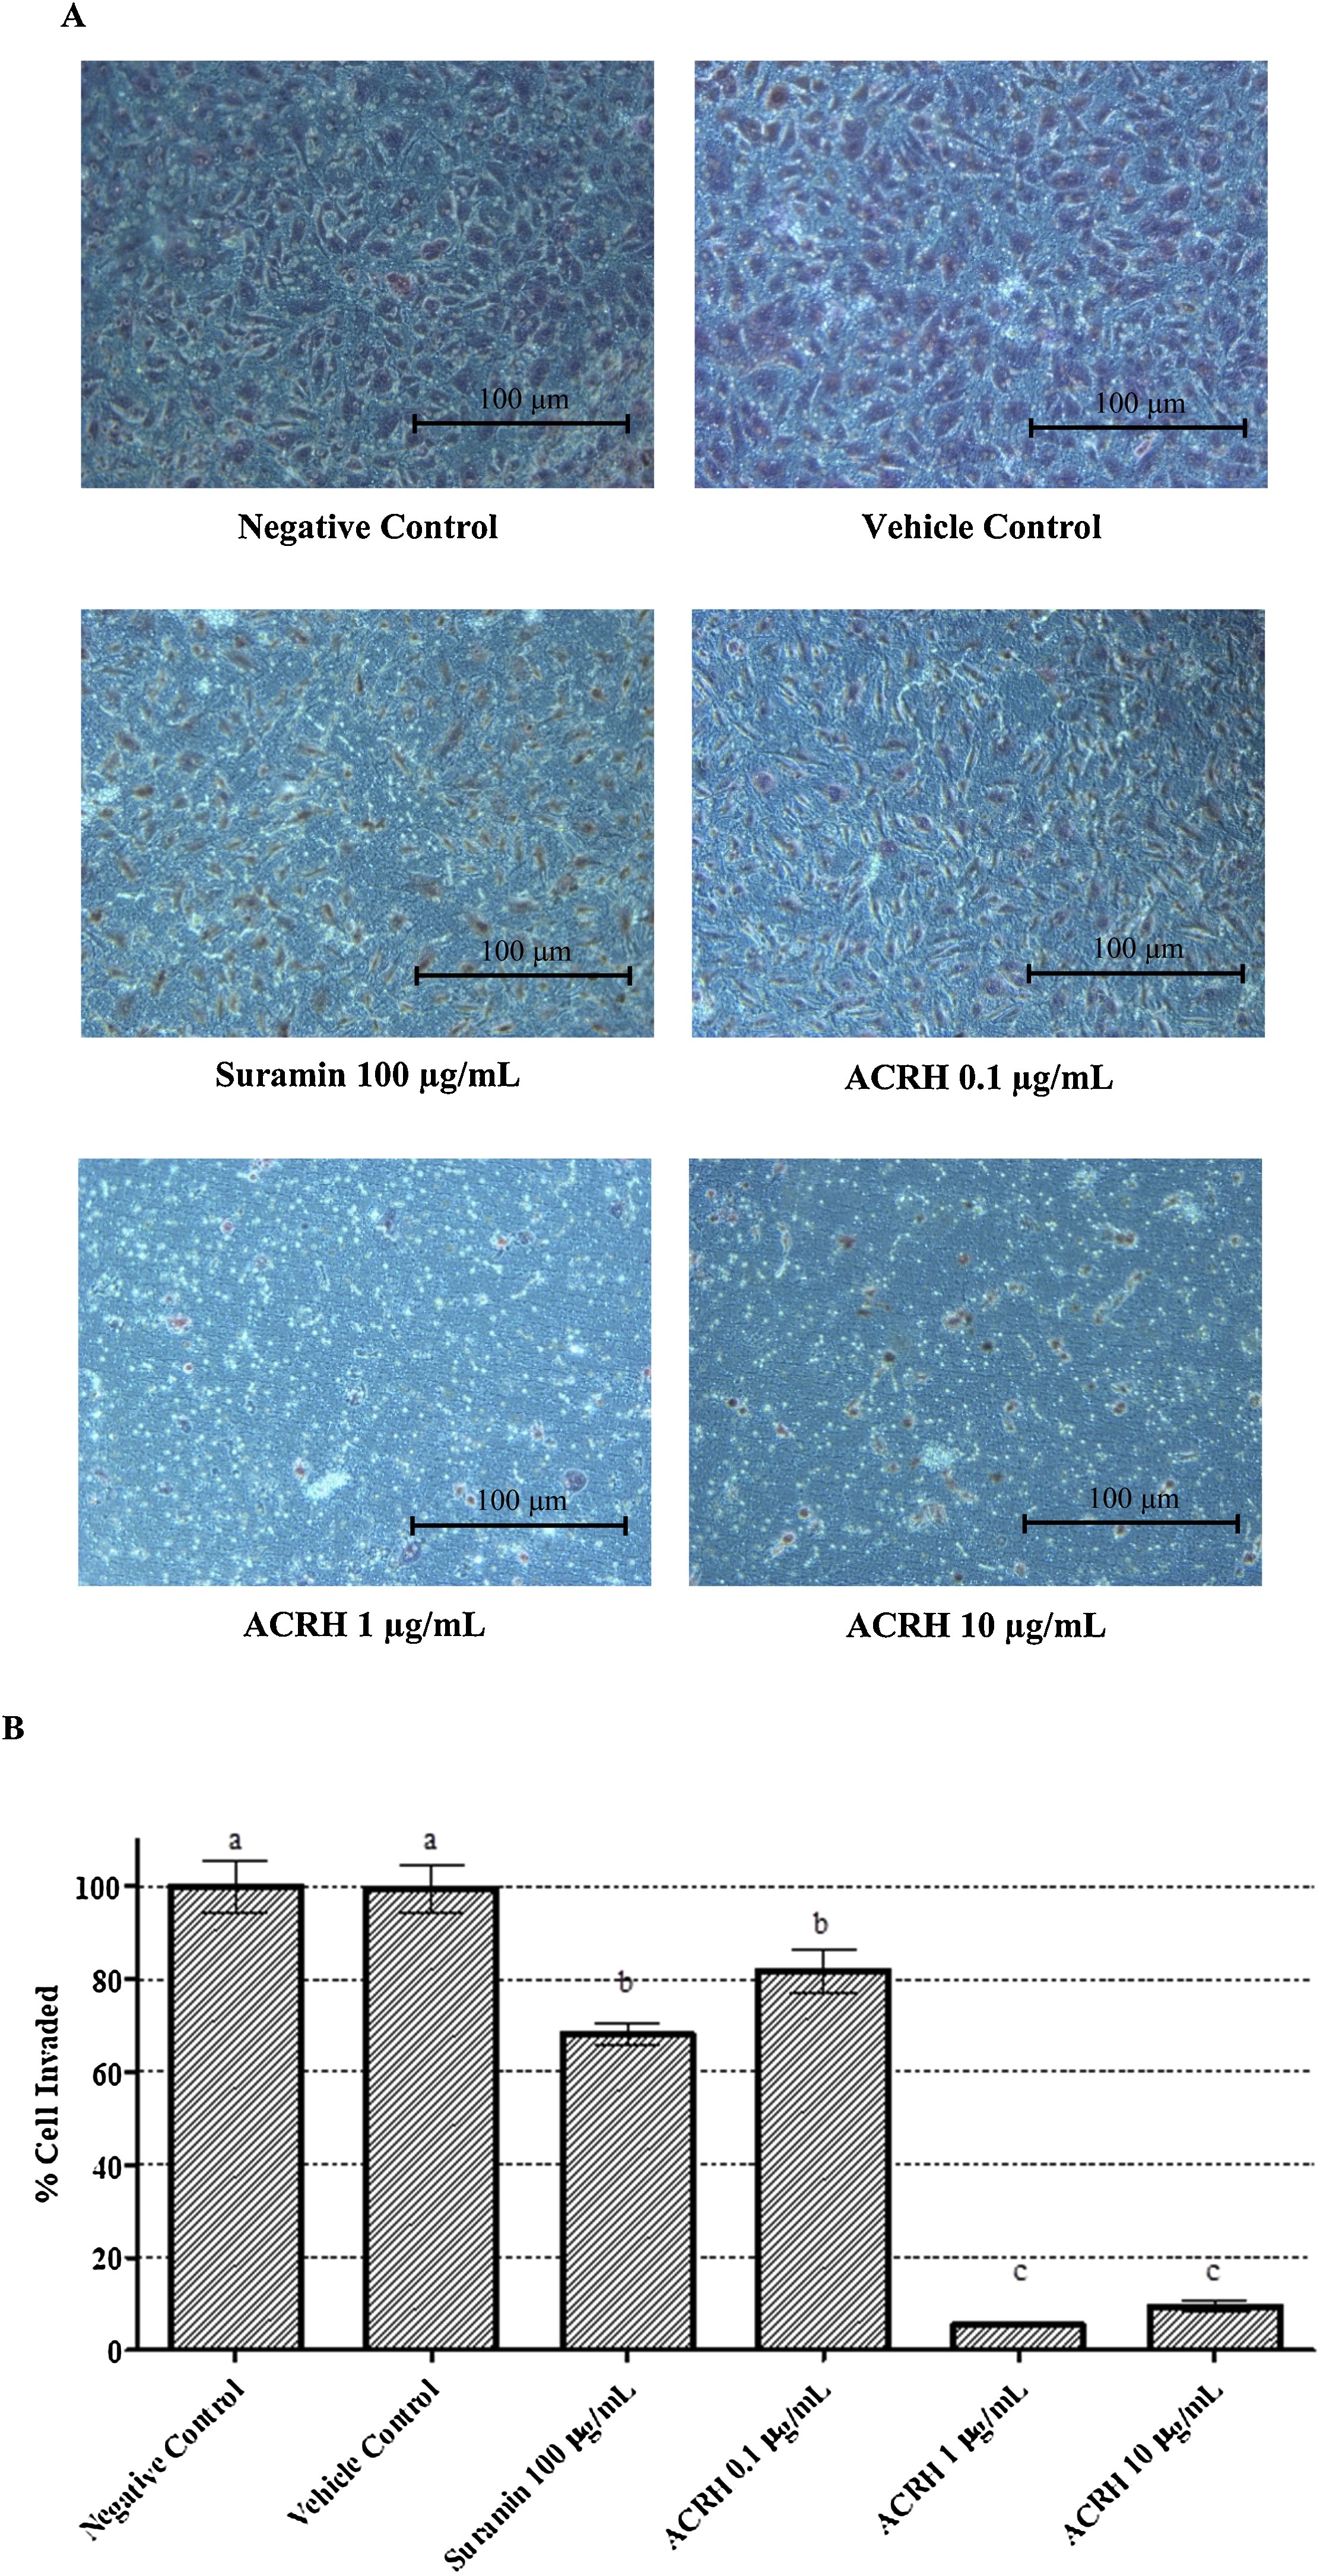
Fig. 5
Inhibitory effect of ACRH on HUVEC invasion through 8 μm pore size PET membrane with a thin layer of Matrigel after 24 h. (A) Representative images of the invaded cells at the bottom of the membrane after 24 h treatment. The bottom of the well which consisted of invaded HUVEC with purple stained nuclei were photographed under the microscope at 200× magnification. (B) The effect of cell invasion was compared in between ACRH treated group with negative control group which quantified by determining the % invasion between negative control group and treatment groups. The quantitative data shown are mean ± SEM of 6 fields reading of each sample (n = 3). Different letters within the same patterned bar are statistically different (p< 0.05).