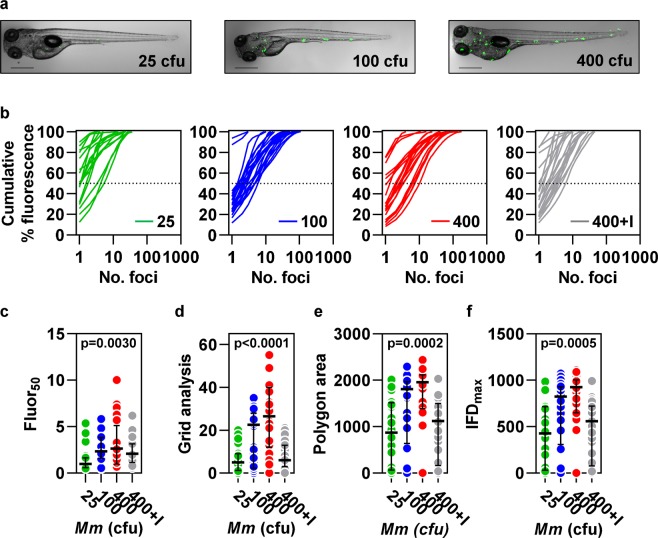
Quantitation of bacterial dissemination in response to a dose titration of intravenous Mycobacterium marinum (Mm) infection. Measures of dissemination in zebrafish larvae four days after intravenous infection with 25, 100 or 400 cfu Mm ± 400 µM isoniazid (I) (n = 24, 28, 22 and 25, respectively). (a) Representative images are shown for each inoculum dose. Scale bars, 500 µm. (b) The relationship between cumulative percentage fluorescence and the number of bacterial foci responsible for this signal. (c) Fluor50, calculated by interpolation of the data shown in (b). The three spatial dissemination parameters, (d) grid analysis, (e) polygon area and (f) IFDmax. Lines (b) and data points (c–f) represent individual zebrafish larvae. Lines and error bars (c–f) represent median ± IQR. p values were derived from Kruskal-Wallis tests with Benjamini, Krieger and Yekutieli correction for multiple comparisons. Data are representative of three independent experiments.
Acknowledgments
This image is the copyrighted work of the attributed author or publisher, and
ZFIN has permission only to display this image to its users.
Additional permissions should be obtained from the applicable author or publisher of the image.
Full text @ Sci. Rep.
Your Input Welcome
Thank you for submitting comments. Your input has been emailed to ZFIN curators who may contact you if
additional information is required.
Oops. Something went wrong. Please try again later.