IMAGE

Figure 1

ID
ZDB-IMAGE-200302-35
Source
Figures for Stirling et al., 2020
Image
Figure Caption

Figure 1

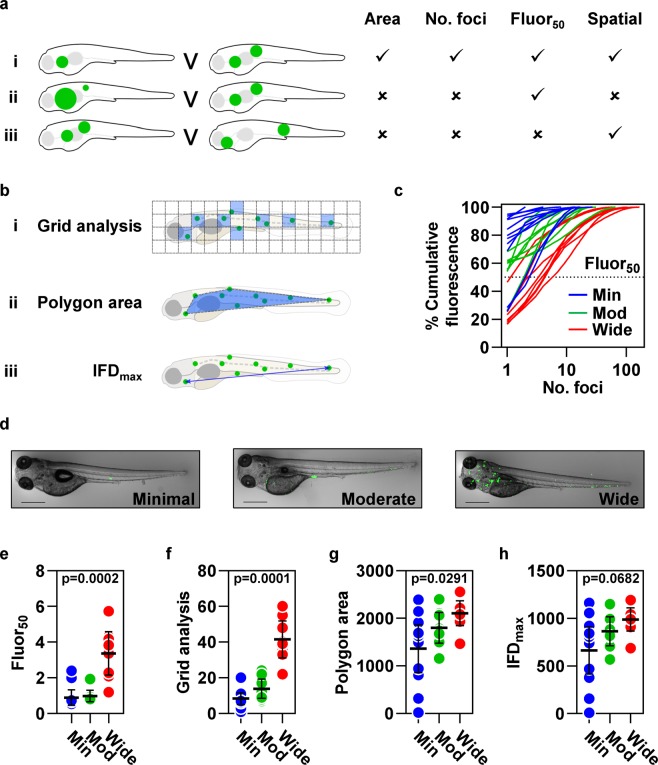
Analysis tools to quantify dissemination of mycobacterial infection. Limitations of existing outcome measurements of infection, illustrated in schematic diagrams representing different distributions of fluorescent bacterial foci (green). Area of fluorescent signal and number of foci distinguish some distributions of infection (ai) but not others (aii–iii). We propose fluor50, the number of foci that contribute 50% of the total fluorescence, to distinguish differences in the proportional distribution of the total burden of pathology at each site (aii) and parameters that quantify the spatial distribution of foci to differentiate localised dissemination from distant dissemination (aiii). (bi) Grid analysis divides the image into an array of squares, then quantifies the number of grid zones containing the centre point of ≥1 foci (highlighted blue). (bii) The area of a polygon (highlighted blue) encompassing the centre points of all foci. (biii) The maximum distance between the centre points of any two foci (IFDmax). (ch) Quantitation of bacterial dissemination in images of zebrafish larvae four days post intravenous infection with 200–400 cfu Mycobacterium marinum expressing mWasabi, selected from three independent experiments, classified as having minimally, moderately or widely disseminated infection (n = 11, 8 and 8, respectively). (c) The relationship between cumulative percentage fluorescence and the number of foci which generate this signal. (d) Representative images from the data presented in (eh) of zebrafish larvae with each category of dissemination. Scale bars, 500 µm. (e) Fluor50, calculated by interpolation of the data shown in (c). Spatial measurements of dissemination, (f) grid analysis, (g) polygon area and (h) IFDmax. Lines (c) and data points (eh) represent individual zebrafish larvae. Lines and error bars (eh) represent median ± IQR. p values were derived from Kruskal-Wallis tests with Benjamini, Krieger and Yekutieli correction for multiple comparisons.

Acknowledgments
This image is the copyrighted work of the attributed author or publisher, and ZFIN has permission only to display this image to its users. Additional permissions should be obtained from the applicable author or publisher of the image. Full text @ Sci. Rep.