
IMAGE
Figure 6—figure supplement 2.
- ID
- ZDB-IMAGE-200228-52
- Publication
- Liu et al., 2020 - Analysis of zebrafish periderm enhancers facilitates identification of a regulatory variant near human KRT8/18
- All Figures
- Figures for Liu et al., 2020
Image
|
Figure Caption
Figure 6—figure supplement 2.
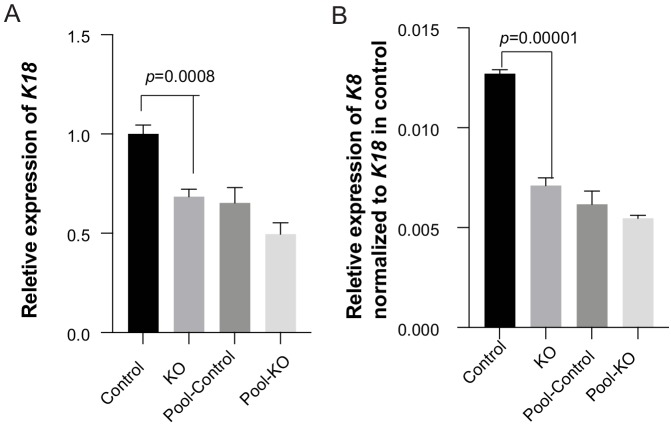
KO: three homozygous knockout colonies; Control: one isolated wildtype colony; Pool-control: pool of GMSM-K cells transfected with two gRNAs only; Pool-KO: Pool of GMSM-K cells transfected with two gRNA along with Cas9 RNP.
Acknowledgments
This image is the copyrighted work of the attributed author or publisher, and
ZFIN has permission only to display this image to its users.
Additional permissions should be obtained from the applicable author or publisher of the image.
Full text @ Elife