
Image
|
Figure Caption
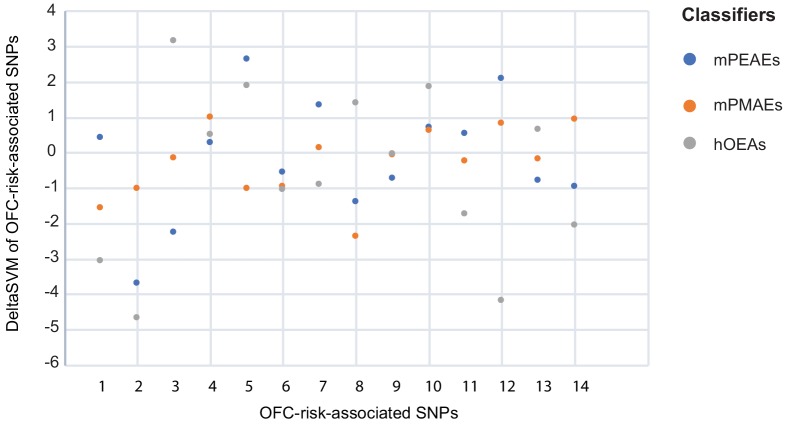
Figure 6—figure supplement 1. Dot plot of deltaSVM scores for each SNP calculated with classifiers trained on the indicated set of enhancer candidates
Acknowledgments
This image is the copyrighted work of the attributed author or publisher, and
ZFIN has permission only to display this image to its users.
Additional permissions should be obtained from the applicable author or publisher of the image.
Full text @ Elife