
Figure 5.
- ID
- ZDB-IMAGE-200228-46
- Publication
- Liu et al., 2020 - Analysis of zebrafish periderm enhancers facilitates identification of a regulatory variant near human KRT8/18
- All Figures
- Figures for Liu et al., 2020
|
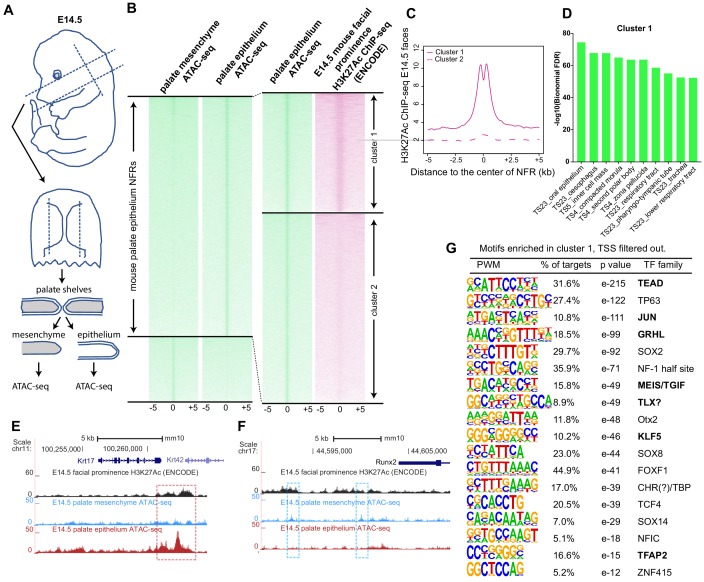
Figure 5. (A) Workflow of ATAC-seq in epithelium and mesenchyme cells isolated from palate shelves dissected from E14.5 embryos. (B) Heatmap plots of ATAC-seq and E14.5 mouse facial prominence H3K27Ac ChIP-seq (Klein and Andersen, 2015) in tissue-specific NFRs. (C) Plot of average density of H3K27Ac ChIP-seq signal, showing higher signal at cluster 1 elements than cluster 2 elements. (D) GO enrichment (MGI mouse gene expression pattern) of genes associated with cluster 1 elements. (E and F) UCSC Genome browser views of the mouse genome (mm10 build) showing the ATAC-seq and H3K27Ac ChIP-seq signals near the Krt17 and Runx2 genes. Red box, an example of a mouse palate-epithelium active enhancer (mPEAE). Blue boxes, examples of mouse palate mesenchyme active enhancers (mPMAEs). (G) Motifs enriched in cluster 1 of E14.5 palate-epithelium specific NFRs with elements overlying transcription start sites removed (i.e., mPEAEs). Motifs shared with zGPAEs are in bold.