
Image
|
Figure Caption
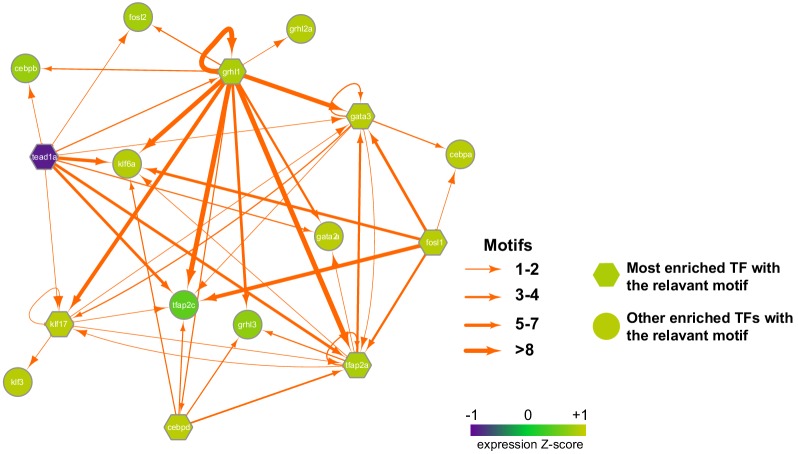
Figure 2—figure supplement 3.
Depending on the expression level in periderm cells (GFP-positive cells) most enriched transcription factors with the relevant motifs are in hexagon while other enriched transcription factors with the relevant motifs are in round. Each TF node is colored according to the normalized expression z-score (related to periderm genes). The thickness of each edge represents the number of motifs located in the all nearby enhancers to each TF (within 100kbp to the transcription start site).
Acknowledgments
This image is the copyrighted work of the attributed author or publisher, and
ZFIN has permission only to display this image to its users.
Additional permissions should be obtained from the applicable author or publisher of the image.
Full text @ Elife