IMAGE

Fig. 2

ID
ZDB-IMAGE-200226-37
Source
Figures for Burrows et al., 2020
Image
Figure Caption

Fig. 2 Example of bifurcation behaviour of a set of coupled oscillators.

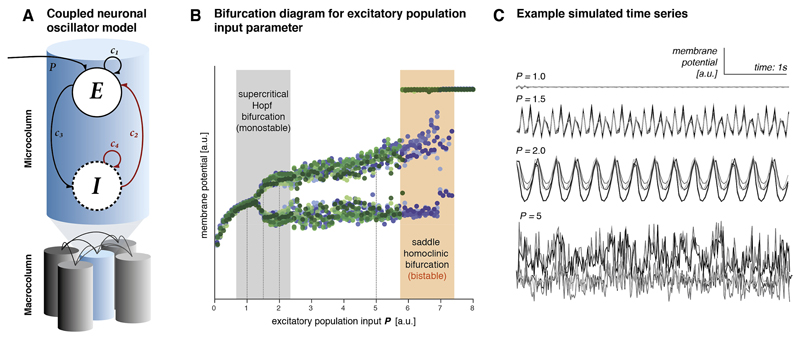
(A) Multiple Wilson-Cowan type neural mass models of excitatory and inhibitory populations were heterogeneously coupled and simulated at different values of excitatory population input P [112]. (B) This graph shows the membrane potential for five coupled microcolumns at steady state for different values of excitatory population input P, with dots of different shades representing a single microcolumn. Stepwise changes in P cause transitions in dynamics from fixed point steady states (shown as single dot per value P) to oscillatory states (shown as peak and trough of the oscillation for each value of P for P > 1.3) and back to fixed point (for P > 7.4). Simulations were run in small increasing (blue), and decreasing (green) steps, revealing bistability in the offset of the oscillation (note that outside of this bistability blue and green are largely overlapping). Even in this simplistic model many different state transition phenomena can be modelled, as sudden switches between high amplitude oscillations and fixed points at the bistable offset bifurcation, where two possible steady states co-exist. (C) Time series examples are shown for increasing values of the parameter P for illustration of different dynamic regimes associated with changes in just the single parameter P. (For interpretation of the references to colour in this figure legend, the reader is referred to the Web version of this article.)

Acknowledgments
This image is the copyrighted work of the attributed author or publisher, and ZFIN has permission only to display this image to its users. Additional permissions should be obtained from the applicable author or publisher of the image. Full text @ Eur. J. Paediatr. Neurol.