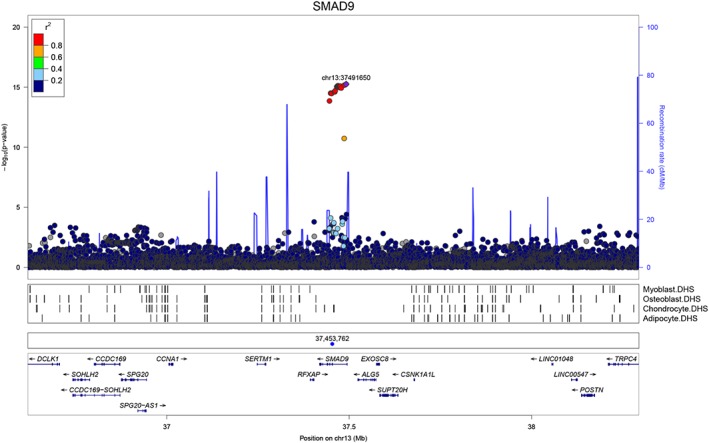
GWAS for eBMD measured in UK Biobank: Regional association plot for the locus containing SMAD9. Top panel: circles show unconditioned GWAS p values and genomic locations of imputed SNPs within ±800 kb of the 5′ and 3′ UTR of each gene. Colors indicate varying degrees of pairwise linkage disequilibrium between the lead eBMD‐associated SNP (rs12427846, purple diamond) and all other SNPs. Second panel: Vertical shaded areas correspond to locations of DNase I hypersensitive sites (DHSs) characteristic of skeletal muscle myoblasts cell line (E120), osteoblast primary cells (E129), mesenchymal stem cell–derived chondrocyte cultured cells (E049) and mesenchymal stem cell–derived adipocyte cultured cells (E023). Red shading depicts intersections between DHSs and genomewide significant SNPs. Black shading denotes instances in which any other SNPs intersect DHSs. Third panel: Blue circle shows the position of the putative causal variant c.65T>C, p.Leu22Pro. Fourth panel: Horizontal lines represent genes with vertical lines annotating location of exons. Arrows indicate the direction in which each gene is transcribed.
Acknowledgments
This image is the copyrighted work of the attributed author or publisher, and
ZFIN has permission only to display this image to its users.
Additional permissions should be obtained from the applicable author or publisher of the image.
Full text @ J. Bone Miner. Res.
Your Input Welcome
Thank you for submitting comments. Your input has been emailed to ZFIN curators who may contact you if
additional information is required.
Oops. Something went wrong. Please try again later.