
Image
|
Figure Caption
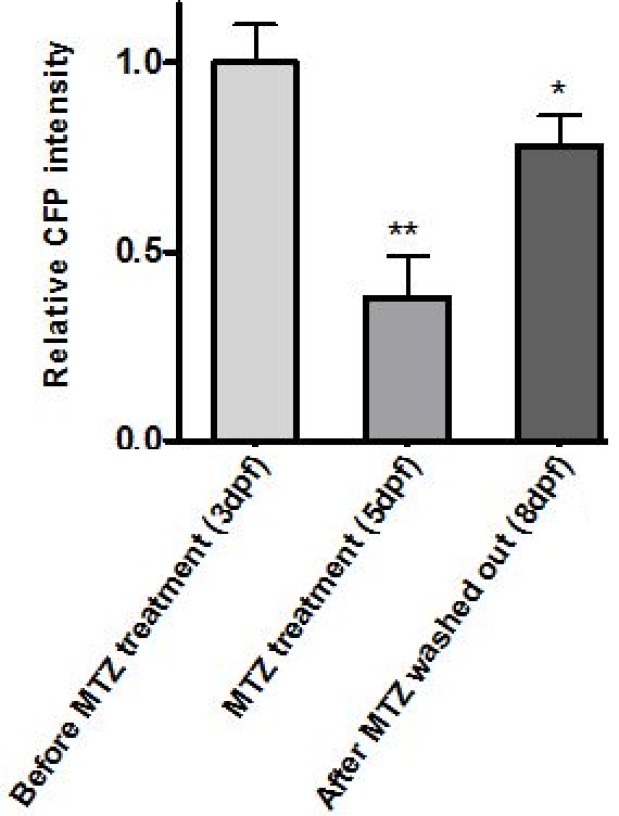
Figure 5
Graph of relative CFP intensities at 3 dpf, 5 dpf and 8dpf. *P<0.05 and **P<0.01, n = 6. (dpf=Days Post Fertilization).
Acknowledgments
This image is the copyrighted work of the attributed author or publisher, and
ZFIN has permission only to display this image to its users.
Additional permissions should be obtained from the applicable author or publisher of the image.
Full text @ Mol Biol Res Commun