
IMAGE
Figure 3.
- ID
- ZDB-IMAGE-200210-42
- Publication
- Nagashima et al., 2019 - Midkine-a is required for cell cycle progression of Müller glia glia during neuronal regeneration in the vertebrate retina
- All Figures
- Figures for Nagashima et al., 2019
Image
|
Figure Caption
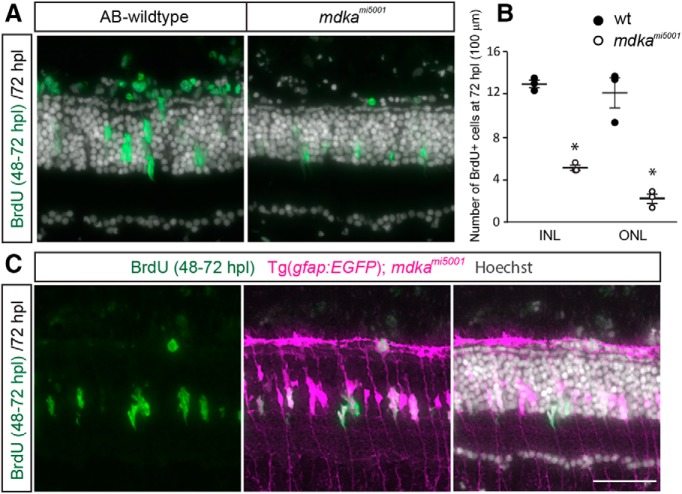
Figure 3.
Some Müller glia in the
Figure Data
Acknowledgments
This image is the copyrighted work of the attributed author or publisher, and
ZFIN has permission only to display this image to its users.
Additional permissions should be obtained from the applicable author or publisher of the image.
Full text @ J. Neurosci.