
Fig 4
- ID
- ZDB-IMAGE-200206-5
- Publication
- Hin et al., 2020 - Accelerated brain aging towards transcriptional inversion in a zebrafish model of the K115fs mutation of human PSEN2
- All Figures
- Figures for Hin et al., 2020
|
Fig 4
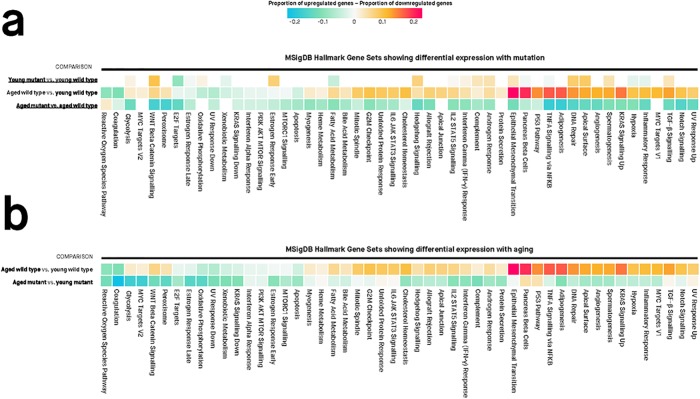
Values in each cell are the estimated proportions of up- and down-regulated genes for each gene set, for any particular pairwise comparison shown to the left of the cells. A missing cell indicates that the particular gene set is not differentially expressed for that particular pairwise comparison. Colours of cells are proportional to the difference between the proportion of up- and down-regulated genes in a gene set. Differentially expressed gene sets have Mixed FDR below 0.05, indicating genes within the gene set show statistically significantly altered (up and/or down) expression for a particular comparison. The genes in each gene set are defined using the “Hallmark” gene set collection at the Molecular Signatures Database (MSigDB).