
Figure 2.
- ID
- ZDB-IMAGE-200205-25
- Publication
- Nichols et al., 2020 - Functional Regeneration of the Sensory Root via Axonal Invasion
- All Figures
- Figures for Nichols et al., 2020
|
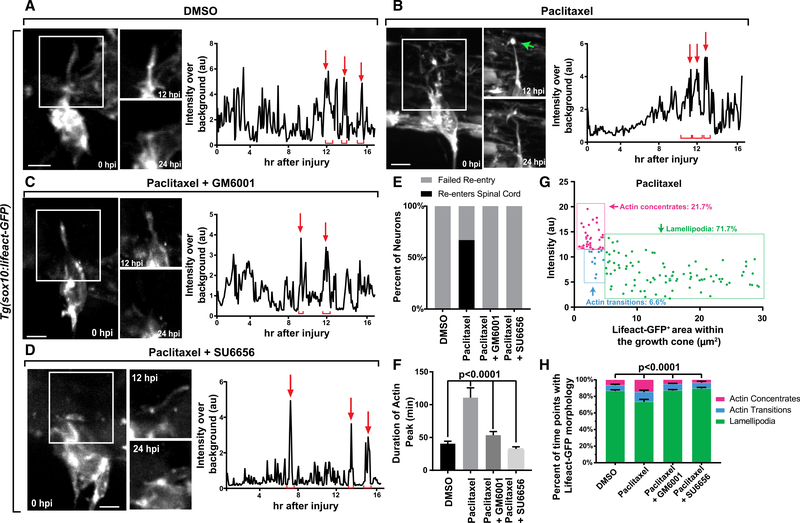
Figure 2.
(A–D) Z-projection time-lapse images of avulsed DRG in
(E) Graph of spinal re-entry in axons treated with DMSO, Taxol, Taxol+GM6001, and Taxol+SU6656.
(F) Duration of actin concentrates in DMSO axons (n = 7), Taxol axons (n = 6), Taxol+GM6001 axons (n = 6), and Taxol+SU6656 axons (n = 4).
(G) Representative scatterplot of growth cone area and average Lifeact-GFP intensity during regeneration in an axon treated with Taxol. Each time point is represented by a point.
(H) Percentage of time points for which the regenerating growth cone displayed each actin organization. Tukey’s HSD was used in (D) and two-way ANOVA was used in (H). Scale bar, 10 mm.