
IMAGE
Fig 4
- ID
- ZDB-IMAGE-200124-5
- Publication
- Ji et al., 2020 - Identification and characterization of miRNAs involved in cold acclimation of zebrafish ZF4 cells
- All Figures
- Figures for Ji et al., 2020
Image
|
Figure Caption
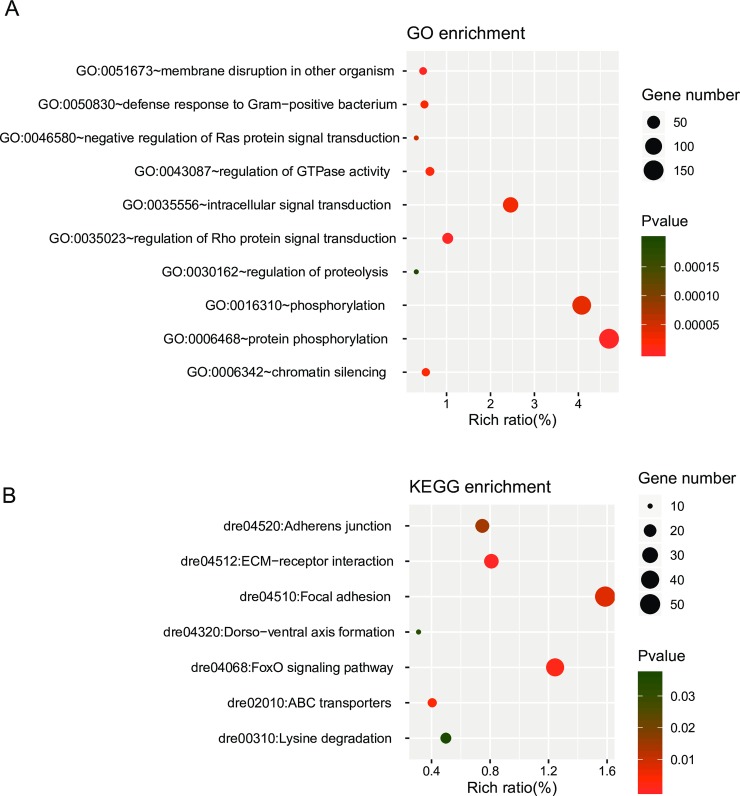
Fig 4
(A-B) GO and KEGG enrichment analyses of the target genes of DE miRNAs. The y-axis corresponds to GO/ KEGG pathway with a p-value ≤ 0.05, and the x-axis shows the enrichment ratio between the number of DE-genes and all unigenes enriched in a particular pathway. The color of the dot represents p-value, and the size of the dot represents the number of DE-genes mapped to the reference pathways.
Acknowledgments
This image is the copyrighted work of the attributed author or publisher, and
ZFIN has permission only to display this image to its users.
Additional permissions should be obtained from the applicable author or publisher of the image.
Full text @ PLoS One