
Fig 3
- ID
- ZDB-IMAGE-200124-4
- Publication
- Ji et al., 2020 - Identification and characterization of miRNAs involved in cold acclimation of zebrafish ZF4 cells
- All Figures
- Figures for Ji et al., 2020
|
Fig 3
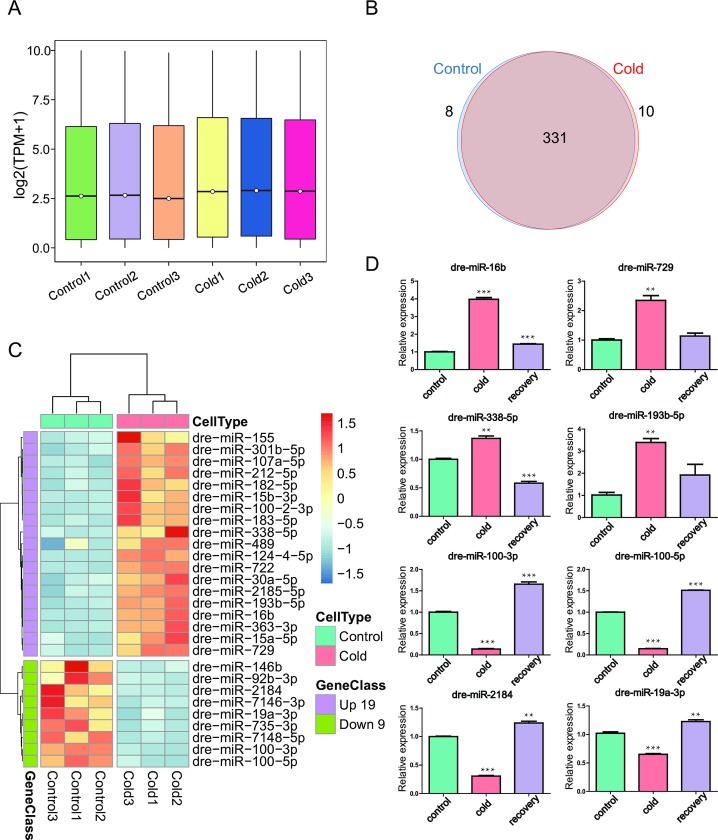
(A) Comparison of miRNA expression levels between small RNA libraries from control and cold acclimated ZF4 cells. (B) Venn diagram shows the number of known miRNAs expressed only in control and cold acclimated ZF4 cells. (C) A heatmap was generated based on fold change values of known DE-miRNAs to visualize the expression patterns of the cold responsive miRNAs. (D) ZF4 cells were cultured at 18°C for 30 days, then returned to 28°C and cultured for another 10 days for recovery. The expression of indicated miRNAs was detected using qRT-PCR. The data are presented as means ± SD of three independent replicates. p <0.05 was considered to indicate a statistically significant result. *: p <0.05, **: p <0.01, ***: p <0.001.