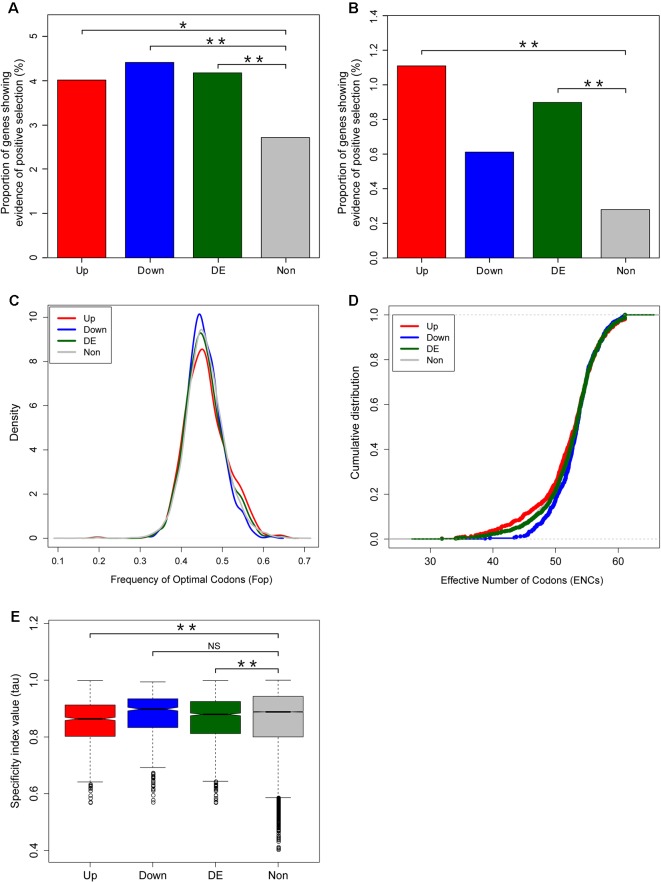
IMAGE

Figure 5

ID
ZDB-IMAGE-200112-9
Source
Figures for Yang et al., 2019
Image
Figure Caption

Figure 5

Adaptive evolution of fright reaction genes in zebrafish. Comparison of the proportions of genes showing evidence of positive selection between differentially expressed and unbiased genes. The percentage of positively selected genes was identified using site mode (A) and branch site model (B) using codeml. (C, D) Codon usage bias in differentially expressed versus unbiased genes, as measured by frequency of optimal codons (Fop) (C) and effective number of codons (D). (E) Breadth of expression between differentially expressed and unbiased genes measured by the specificity index value (τ). Significant differences were indicated by the asterisks, based on Chi-squared test, *P < 0.05, **P < 0.001. NS means non significant.

Acknowledgments
This image is the copyrighted work of the attributed author or publisher, and ZFIN has permission only to display this image to its users. Additional permissions should be obtained from the applicable author or publisher of the image. Full text @ Front Genet