
|
Figure 1
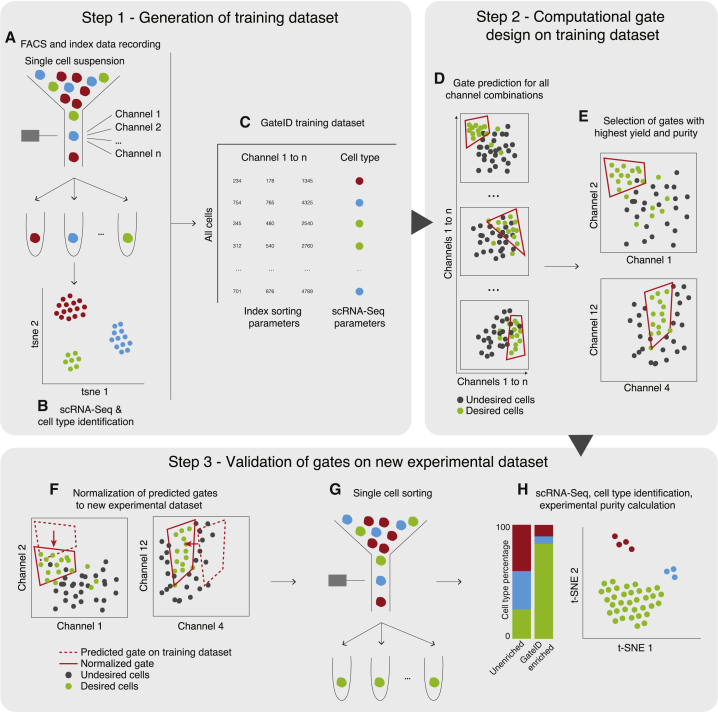
GateID Workflow
In step 1, the GateID TD is generated.
(A) Live single cells from the organ of interest are sorted in an unbiased manner, and index data for all available channels are recorded.
(B) Single cells sorted in (A) are sequenced to determine the cell type composition of the organ.
(C) The TD is generated after merging the FACS index data and the cell type information for each single cell.
In step 2, the gates are computationally designed for the desired cell type.
(D) Gates are computed for each possible combination of channels.
(E) The best combination of gates is chosen to maximize the yield and purity of the desired cell type.
In step 3, GateID-predicted gates are tested experimentally.
(F) The predicted gates are normalized to the new experimental dataset.
(G) Single cells in GateID gates are sorted.
(H) After scRNA-seq, cell types present in the GateID-enriched library are determined, and the experimental purity is calculated by comparison with the unenriched library.
See also
Reprinted from Cell, 179, Baron, C.S., Barve, A., Muraro, M.J., van der Linden, R., Dharmadhikari, G., Lyubimova, A., de Koning, E.J.P., van Oudenaarden, A., Cell Type Purification by Single-Cell Transcriptome-Trained Sorting, 527-542.e19, Copyright (2019) with permission from Elsevier. Full text @ Cell