
IMAGE
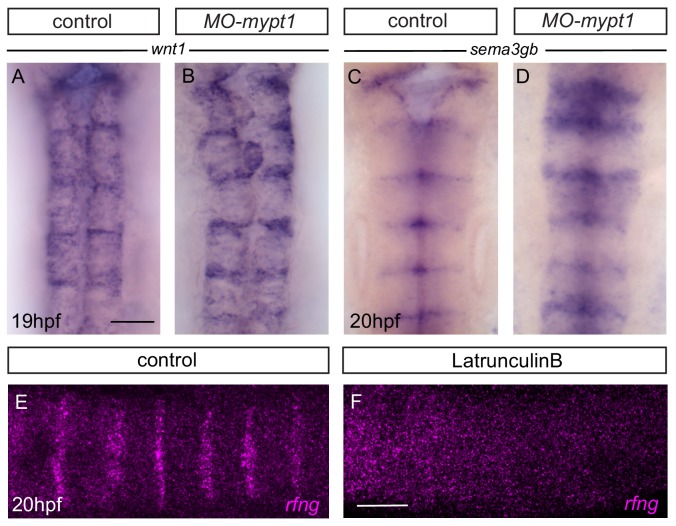
Figure 3—figure supplement 1.
- ID
- ZDB-IMAGE-191230-411
- Publication
- Cayuso et al., 2019 - Actomyosin regulation by Eph receptor signaling couples boundary cell formation to border sharpness
- All Figures
- Figures for Cayuso et al., 2019
Image
|
Figure Caption
Figure 3—figure supplement 1.
(
Acknowledgments
This image is the copyrighted work of the attributed author or publisher, and
ZFIN has permission only to display this image to its users.
Additional permissions should be obtained from the applicable author or publisher of the image.
Full text @ Elife