
Image
|
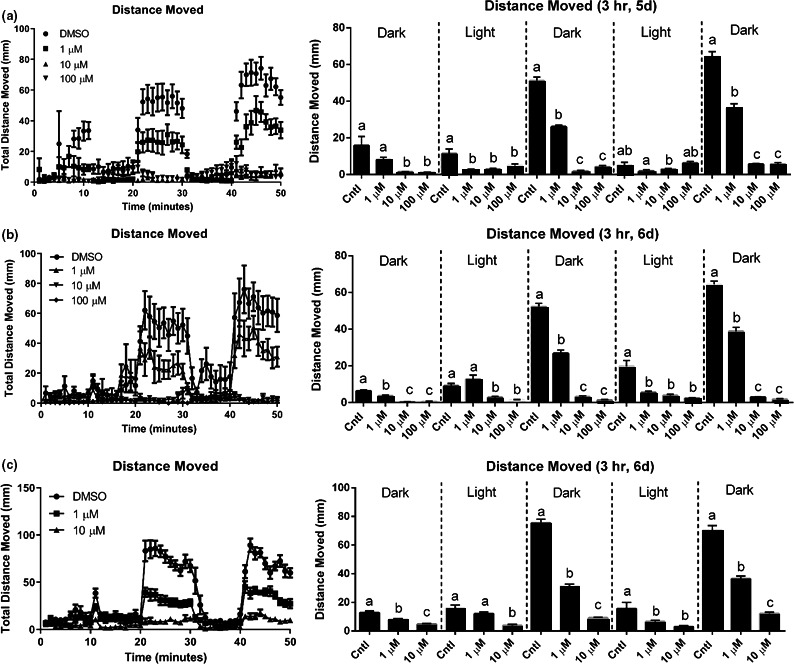
Figure Caption
Figure 2
Locomotor analysis of distance moved over the 50 min during a visual motor response (VMR) test after 3‐hr treatment to pyrovalerone. Each graph (left and right) represents an independent experiment. Group mean of the distance‐moved (mm)‐per‐minute intervals for fish (right panel). Total distance moved in each interval of the light and dark. Data are presented as mean value ±
Acknowledgments
This image is the copyrighted work of the attributed author or publisher, and
ZFIN has permission only to display this image to its users.
Additional permissions should be obtained from the applicable author or publisher of the image.
Full text @ Brain Behav