IMAGE

Figure 7

ID
ZDB-IMAGE-191230-198
Source
Figures for Molagoda et al., 2019
Image
Figure Caption

Figure 7

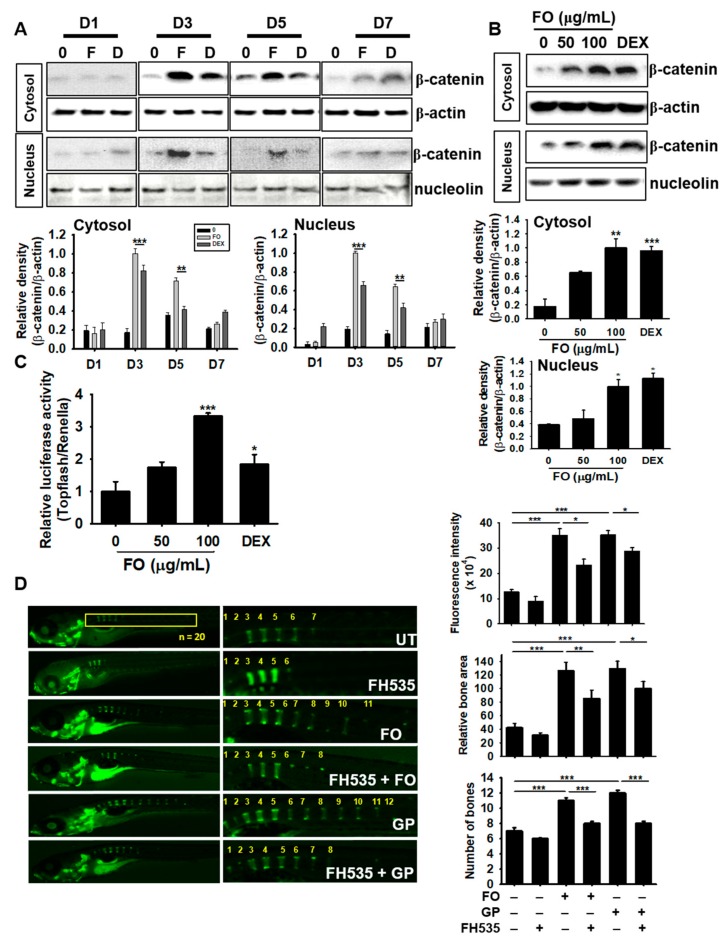
FO enhances osteogenesis via crosstalk with the Wnt/β-catenin pathway. MC3T3-E1 cells were treated with 100 µg/mL of FO and 100 nM DEX for 7 days. (A) The cells were harvested at day 1 (D1), day 3 (D3), day 5 (D5), and day 7 (D7). Next, western blot analysis was performed to quantify β-catenin expression. (B) The cells were treated with 50 µg/mL and 100 µg/mL of FO or 100 nM DEX for 3 days. Total protein was extracted to quantify β-catenin expression in the cytosol and nucleus. (C) To evaluate the effect of β-catenin/TCF signaling, TOPFlash activity was determined. (D) Zebrafish larvae (3 dpf; n = 20) were pretreated with FH535 for 24 h and then treated with 100 µg/mL of FO or 100 nM DEX. The larvae were stained with calcein to observe vertebrae formation and mineralization 10 dpf. Relative calcein fluorescence intensity and total bone area were quantified using the Image J software and the number of vertebrae was manually counted. Significant differences among the groups were determined using the one-way ANOVA followed by Bonferroni correction. All data are presented as mean ± SEM (*** p < 0.001, ** p < 0.01, and * p < 0.05 versus untreated group). FO; fermented extract of C. gigas, DEX; dexamethasone, GP; β-glycerophosphate, dpf; days post fertilization, and UT; untreated group.

Acknowledgments
This image is the copyrighted work of the attributed author or publisher, and ZFIN has permission only to display this image to its users. Additional permissions should be obtained from the applicable author or publisher of the image. Full text @ Biomolecules